Download our Editable PowerPoint Dashboard Templates

Dashboard layout including a bar chart of company data, a pie chart for quarterly sales distribution.
P.ID : 26654
    445 views
    52 Downloads
    Get Custom Slides by Experts
    Instantly Access Templates in PowerPoint

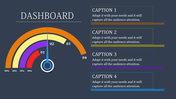
    Creative Dashboard PowerPoint Template For Presentation

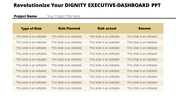
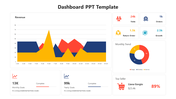
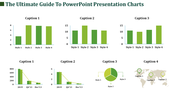
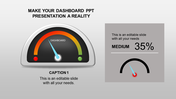
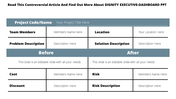
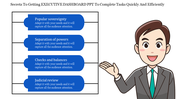
    Download our Dashboard PowerPoint Templates to make your presentation engaging and feel great. This slide is designed with a table, graph, and bar chart to illustrate the business and market report. Users can utilize this infographic template in the academy, business, and public plan meetings. 

    About This Slide:

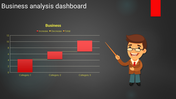
    This Progress Dashboard Template contains a bar chart, table, and graph. This template will engage your targeted audience and increase their curiosity. We also have a pack of the best PowerPoint PPT slides. It is a pre-built Dashboard slide with all the elements you need to design the most helpful progress presentation. Users can modify the font style, color, text, and font size at your ease. Users can add their project report data to a text holder in time.

    Features of this template

    • 100% Customizable (shape color, size & text)
    • This template has a chart theme.
    • Drag and drop image placeholder
    • Huge Collections of dashboard slides to impress your audience
    • This graph slide supports the 16:9 and 4:3 format
    • Easily readable and acceptable template.
    Advertisement

    You May Also Like These PowerPoint Templates

    Add to Wishlist
    Download
    AI Customize
    Dashboard slide with a speedometer gauge in red, blue, yellow, and teal, and text bullet points on the left.
    Add to Wishlist
    Download
    AI Customize
    PPT template featuring a marketing dashboard with a colorful pie chart, bar graph, and progress bars for data presentation.
    Add to Wishlist
    Download
    AI Customize
    Green themed diagram illustrating stages of analysis delivery, from data source to client reports and dashboards.
    Add to Wishlist
    Download
    AI Customize
    A slide showcasing four different chart types from Column Histogram to Scatter Plot with corresponding data.
    Add to Wishlist
    Download
    AI Customize
    Project summary dashboard showing project statistics, budget, actual performance, and project performance by category.
    Add to Wishlist
    Download
    AI Customize
    Circular gauge template with sections in red, orange, yellow, green, and dark green, with captions on either side.
    Add to Wishlist
    Download
    AI Customize
    Infographic dashboard featuring a world map with COVID-19 case data, a gender-based death rate chart, and a pie chart.
    Add to Wishlist
    Download
    AI Customize
    Sashboard design featuring three plant species data and corresponding progress meters in red, green, and blue.
    Add to Wishlist
    Download
    AI Customize
    Chart PPT template showing 4 progress circles with percentages and color coded sections for Blue, Green, Yellow, and Orange.
    Free
    Add to Wishlist
    Download
    AI Customize
    Executive dashboard slide with five numbered circular icons on dark blue shapes, each labeled with key principles.
    Add to Wishlist
    Download
    AI Customize
    Dashboard layout with bar, pie, and stacked charts in yellow, orange, red, and green on a white background.
    Add to Wishlist
    Download
    AI Customize
    Infographic featuring pie graph, horizontal and vertical bar charts for visualizing data trends and comparisons.
    Add to Wishlist
    Download
    AI Customize
    Executive slide showing expense meters, world sales performance, and bar graphs for margin, expenses, and revenue by month.
    Add to Wishlist
    Download
    AI Customize
    KPI template displaying financial metrics, including sales, profitability, liquidity, and leverage, with two gauge charts.
    Add to Wishlist
    Download
    AI Customize
    Executive dashboard slide with a pie chart, bar graph, area chart, and a profile section for job title and details.
    Add to Wishlist
    Download
    AI Customize
    KPI dashboard template PowerPoint slide featuring three sections for data visualization.
    Add to Wishlist
    Download
    AI Customize
    Dashboard layout including a bar chart of company data, a pie chart for quarterly sales distribution.