Executive Dashboard PPT And Google Slides Template

Executive dashboard PowerPoint slide featuring line and bar charts, pie charts, and world map markers for data analysis.
P.ID : 4179
    852 views
    136 Downloads
    Get Custom Slides by Experts
    Instantly Access Templates in PowerPoint

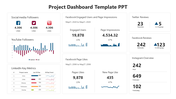
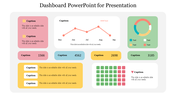
    Executive Dashboard PowerPoint Template


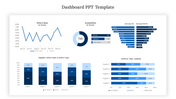
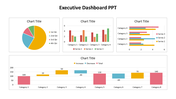
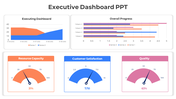
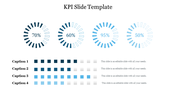
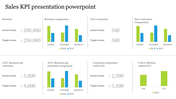
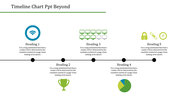
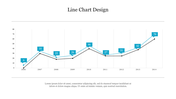
    The executive dashboard PowerPoint presentation is a dynamic and comprehensive visual tool tailored for senior leaders and decision-makers, consolidating essential key performance indicators and critical business metrics into a single, accessible interface. Featuring a vibrant Multicolor Theme and fully editable slides, this template is designed for executives seeking to construct impactful dashboards enriched with diverse chart types such as line charts, bar charts, pie charts, and maps. It serves as a practical resource, fostering a clear and visually engaging framework for presenting complex data, thereby facilitating informed decision-making, strategic agility, and effective alignment with business objectives. Ideal for executives, managers, and decision-makers, the presentation encourages users to leverage this template to streamline their reporting processes, fostering a culture of data-driven decision-making and ensuring success in the ever-evolving business landscape.


    Features of this template


    • 100% customizable slides and easy to download.
    • The slide contains 16:9 and 4:3 formats.
    • Easy to change the colors of the slide quickly.
    • Highly compatible with PowerPoint and Google Slides.
    • Well-crafted template with an instant download facility.
    Advertisement

    You May Also Like These PowerPoint Templates

    Add to Wishlist
    Download
    AI Customize
    3D cone charts in blue shades with percentage labels, showing two datasets with a legend on the right.
    Add to Wishlist
    Download
    AI Customize
    Gantt chart template illustrating project phases, milestones, and a timeline structure from January to December.
    Add to Wishlist
    Download
    AI Customize
    Matrix chart with skill and will axes, divided into quadrants labeled high and low, with numbered circles and icons.
    Add to Wishlist
    Download
    AI Customize
    PowerPoint chart template displaying three donut charts with percentages and icons representing data categories.
    Add to Wishlist
    Download
    AI Customize
    Project plan Gantt chart template displaying tasks with milestones and progress percentages across months from Jan to Dec.
    Add to Wishlist
    Download
    AI Customize
    Bar chart presentation showing data from 2017 to 2020, with values 2.4, 4.4, 1.8, and 2.8, respectively.
    Free
    Add to Wishlist
    Download
    AI Customize
    Horizontal timeline graphic with five purple arrows, labeled captions and date ranges, aligned with a month indicator.
    Add to Wishlist
    Download
    AI Customize
     Project timeline chart with horizontal bars indicating tasks with milestone markers placed in white background.
    Add to Wishlist
    Download
    AI Customize
    3D pie chart with four color-coded segments red, orange, yellow, and brown displaying percentage values.
    Free
    Add to Wishlist
    Download
    AI Customize
    Bar chart slide with three stacked bars, each divided into segments with percentage labels, and a table on the right.
    Add to Wishlist
    Download
    AI Customize
    Gantt chart layout with five vertical milestone markers in blue, black, brown, green, and yellow.
    Add to Wishlist
    Download
    AI Customize
    Timeline charts slides showcasing different stages and tasks across various projects, with color coded bars for each task.
    Free
    Add to Wishlist
    Download
    AI Customize
    Slide with four green donut charts and two horizontal bar graphs showing data comparisons across quarters and months.
    Free
    Add to Wishlist
    Download
    AI Customize
    Illustration of six red bars with corresponding percentages and a businesswoman standing beside them.
    Free
    Add to Wishlist
    Download
    AI Customize
    Business strategy chart with blue headers for months, showing green bars representing schedules.
    Add to Wishlist
    Download
    AI Customize
    Stacked bar chart with four vertical bars showing percentages from 2013, 2014, and 2015 in varying green shades.
    Free
    Add to Wishlist
    Download
    AI Customize
    Business plan slide showing bar chart comparing impact of society, customer satisfaction, and people satisfaction.
    Add to Wishlist
    Download
    AI Customize
    Color-coded bars representing business growth from 2015 to 2019, with a percentage line graph above showing a rise.
    Add to Wishlist
    Download
    AI Customize
    Project timeline Gantt chart with color coded bars indicating task descriptions, assigned resources, and milestone markers.