Free - Get medal worthy Tachometer Template Free Download

Free
 Row of colorful tachometers with different needle positions, each paired with a corresponding caption box.
P.ID : 48961
    561 views
    188 Downloads
    Get Custom Slides by Experts
    Instantly Access Templates in PowerPoint

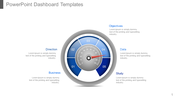
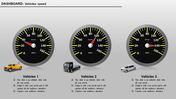
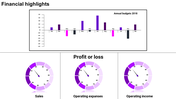
    Free Creative Tachometer Design Template

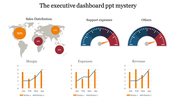
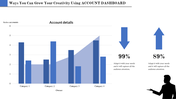
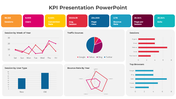
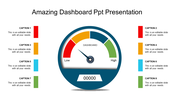
    A tachometer is an instrument that can be used to measure the disk and shaft speed. The measurement of tachometers can be accurately reported with this exclusive presentation template. This template is effective with four nodes, and the concept can be well explained with its creative designs. The meter design can be added for the topic explanation with the reports and results. Its user-friendly features can enhance the importance of the presentation. The customizable features can help you make the presentation a success. Download now!

    Features of the template 

    • 100% customizable slides and easy to download.
    • Slides are available in different nodes & colors.
    • The slide contains 16:9 and 4:3 formats.
    • Easy to change the colors of the slide quickly.
    • Well-crafted template with instant download facility.
    • Free template with dashboard design.
    Advertisement

    You May Also Like These PowerPoint Templates

    Add to Wishlist
    Download
    AI Customize
    Business dashboard with progress indicators for promotion, channel management, and revenue metrics.
    Add to Wishlist
    Download
    AI Customize
    A dashboard style slide showing plant growth data for Zantedeschia, Celosia, and Calendula with gauge charts and a bar graph.
    Add to Wishlist
    Download
    AI Customize
    Botanical data dashboard template  showing performance metrics for flower species, featuring line and bar charts.
    Free
    Add to Wishlist
    Download
    AI Customize
    Colorful dashboard style meters PPT slide with captions and placeholder text.
    Free
    Add to Wishlist
    Download
    AI Customize
    Dashboard layout featuring a line graph, pie chart, net worth value, and categorized assets and liabilities in green theme.
    Add to Wishlist
    Download
    AI Customize
    PowerPoint slide with multiple chart types, including bar, line, and pie charts with different styles.
    Free
    Add to Wishlist
    Download
    AI Customize
    Executive dashboard slide featuring different vehicles like bike, car, container, train, and plane with title sections.
    Add to Wishlist
    Download
    AI Customize
    KPI dashboard featuring a funnel chart, audience metrics, bar graph, and a circular chart with 2021 data.
    Free
    Add to Wishlist
    Download
    AI Customize
    Executive dashboard template featuring six blue columns with titles and alternating light and dark blue text boxes.
    Add to Wishlist
    Download
    AI Customize
    KPI dashboard template with four gauges in blue, green, orange, and red, alongside a flowchart with colored boxes.
    Add to Wishlist
    Download
    AI Customize
    Colorful dashboard PPT template featuring financial figures, text placeholders, and a radar chart for visual data analysis.
    Free
    Add to Wishlist
    Download
    AI Customize
    Slide featuring a bar graph and line chart showing monthly money transactions, alongside silhouettes of people shaking hands.
    Free
    Add to Wishlist
    Download
    AI Customize
    PowerPoint template featuring a colorful dashboard with bar graphs, pie charts, progress rings, and a timeline for data.
    Add to Wishlist
    Download
    AI Customize
    Dashboard showing expense meters, global percentages on a map, and a bar chart visualizing data distribution.
    Add to Wishlist
    Download
    AI Customize
    Slide deck with KPI charts and graphs for business analysis, including financials, HR performance, and customer service.
    Add to Wishlist
    Download
    AI Customize
    KPI dashboard template with a line chart, progress indicators, and bar graphs showing different performance metrics.
    Free
    Add to Wishlist
    Download
    AI Customize
    Dashboard layout includes a line graph, pie chart, and three bar graphs, all colored in red, green, and blue.