PowerPoint Speedometer Template and Google Slides

 Canva
Canva
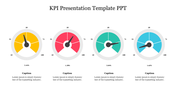
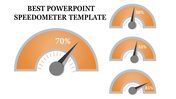
PowerPoint Speedometer Template
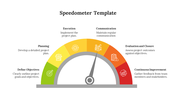
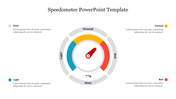
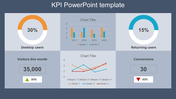
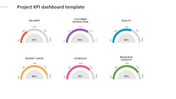
Accelerate your presentations to new heights with our dynamic PowerPoint Speedometer Template. The slide has four speedometers in varying colors. Each of them comes with a percentage value. It provides an engaging way to convey metrics, progress and performance.
Suitable for business executives, project managers, consultants and analysts. An apt template to showcase key performance indicators, project milestones, goal attainment, presenting quarterly results, tracking sales targets or monitoring project progress. Download now and drive your message home with precision and impact!
Features of the template
- The slide contains 16:9 and 4:3 formats.
- Compatible with Google slide themes and PowerPoint.
- 100% customizable slides and easy to download.
- It is easy to change the colors of the slide quickly.
- Well-crafted template with an instant download facility.


You May Also Like These PowerPoint Templates
Add to Wishlist
Download
Edit

Add to Wishlist
Download
Edit

Add to Wishlist
Download
Edit

Add to Wishlist
Download
Edit

Add to Wishlist
Download
Edit

Add to Wishlist
Download
Edit

Add to Wishlist
Download
Edit

Add to Wishlist
Download
Edit

Add to Wishlist
Download
Edit

Add to Wishlist
Download
Edit

Add to Wishlist
Download
Edit

Add to Wishlist
Download
Edit

Add to Wishlist
Download
Edit

Add to Wishlist
Download
Edit

Add to Wishlist
Download
Edit

Add to Wishlist
Download
Edit

Add to Wishlist
Download
Edit


Add to Wishlist
Download
Edit

Add to Wishlist
Download
Edit
