Editable Speedometer PowerPoint And Google Slides Template

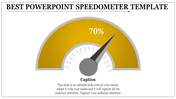
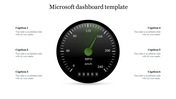
Speedometer Presentation Slide
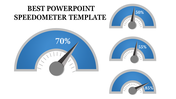
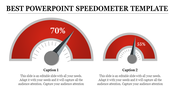
Dive into the world of the Speedometer, a crucial component of any vehicle that visually represents the vehicle's speed. This device provides real-time feedback to drivers, helping them maintain safe and legal speeds on the road. Speedometers work on the principle of converting the rotation of the vehicle's wheels into a speed reading on the dashboard. They serve as a fundamental tool for ensuring road safety and adherence to traffic regulations. With an easy-to-read display, speedometers keep drivers informed, contributing to safer and more responsible driving practices. Understanding the concept of a speedometer is not only essential for drivers but also for the maintenance and regulation of vehicle performance. Speedometer is a valuable resource for professionals and educators in the automotive industry, driving instructors, and even individuals looking to explain or understand the importance of speedometers. This PowerPoint template simplifies the complex task of explaining speedometers and their significance. All slides are fully editable, offering flexibility for customization to address specific educational or training needs. Users can gain numerous advantages, including time savings and the ability to effectively convey the importance of speedometers in safe driving. By using this template, they can facilitate a deeper understanding of speedometer concepts, ultimately contributing to responsible driving practices and road safety. We wholeheartedly encourage the audience to employ Speedometer as a powerful tool to educate and raise awareness about responsible driving practices.
Features of the template:
- 100% customizable slides and easy to download.
- Slides are available in different nodes & colors.
- The slide contains 16:9 and 4:3 formats.
- Easy to change the colors of the slides quickly.
- Well-crafted template with an instant download facility.
- Highly compatible with PowerPoint and Google Slides.
- Speedometer design with text area.


You May Also Like These PowerPoint Templates

Add to Wishlist
Download
Edit

Add to Wishlist
Download
Edit

Add to Wishlist
Download
Edit


Add to Wishlist
Download
Edit

Add to Wishlist
Download
Edit

Add to Wishlist
Download
Edit

Add to Wishlist
Download
Edit

Add to Wishlist
Download
Edit

Add to Wishlist
Download
Edit


Add to Wishlist
Download
Edit

Add to Wishlist
Download
Edit

Add to Wishlist
Download
Edit

Add to Wishlist
Download
Edit

Add to Wishlist
Download
Edit

Add to Wishlist
Download
Edit

Add to Wishlist
Download
Edit

Add to Wishlist
Download
Edit
