Impressive Chart Presentation Template And Google Slides

Chart PPT template with bar graphs showing clicks and recipients, a pie chart for email categories, and a line graph.
P.ID : 34119
    301 views
    27 Downloads
    Get Custom Slides by Experts
    Instantly Access Templates in PowerPoint

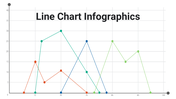
    Powerful Chart Presentation Template


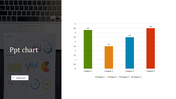
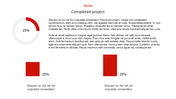
    The chart presentation template features a two-colored chart that can be used to compare data over time. This is a great way to show trends and patterns in your data. The template also includes a graph that can be used to show the overall results of your data.

    Who can benefit from this template?
    • Business professionals: Use it to present data to colleagues, clients, or investors.
    • Educators: Use it to create engaging presentations for students.
    • Marketers: Use it to create presentations that will resonate with your target audience.

    This easy-to-use template will save you time and effort when creating your presentations. Stop struggling to create clear and informative presentations and download this template today.

    Features of the template


    • 100% customizable slides and easy to download.
    • The slides contain 16:9 and 4:3 formats.
    • Easy to change the colors quickly.
    • It is a well-crafted template with an instant download facility.
    • It is a 100% pre-designed slide.
    • The slide holds vibrant colors.
    Advertisement

    You May Also Like These PowerPoint Templates

    Free
    Add to Wishlist
    Download
    AI Customize
    Four vertical pointed icons in red, blue, purple, and orange, each aligned with caption on a light background.
    Add to Wishlist
    Download
    AI Customize
    Project dashboard slides with Gantt chart, a burndown chart, and a timeline, using a palette of brown, green, and red.
    Add to Wishlist
    Download
    AI Customize
    Tachometer PowerPoint slide with gauges indicating 10, 20, and 30 with captions for each.
    Add to Wishlist
    Download
    AI Customize
    Concentric pentagons in black with text areas around each corner, forming a simple monochrome layout.
    Add to Wishlist
    Download
    AI Customize
    Horizontal infographic with four tachometer icons in gradient colors, labeled with captions for each gauge.
    Add to Wishlist
    Download
    AI Customize
    Slide featuring a tachometer dial with four performance levels and linked captions in red, yellow, maroon, and blue.
    Add to Wishlist
    Download
    AI Customize
    Dashboard layout with charts in orange tones, including a donut chart, bar graphs, and a line chart for monthly data.
    Add to Wishlist
    Download
    AI Customize
    Slide with four red speedometers, each indicating a different percentage level, against a white background.
    Add to Wishlist
    Download
    AI Customize
    Blue themed dashboard layout with a line chart, two growth metrics, and three semi circle gauges for budget.
    Free
    Add to Wishlist
    Download
    AI Customize
    Circular speedometer with orange and gray segments, displaying kilometer markings from 5.5 KM to 8 KM.
    Free
    Add to Wishlist
    Download
    AI Customize
    Dashboard graphic featuring a circular speedometer with a red needle, surrounded by text labels for various business metrics.
    Add to Wishlist
    Download
    AI Customize
    Speedometer slide with three colorful gauges showing percentages each with captions.
    Add to Wishlist
    Download
    AI Customize
    Dashboard with a red line graph for Jan-May and a bar chart of four colored percentage bars and category icons.
    Free
    Add to Wishlist
    Download
    AI Customize
    Dashboard with line chart for appointments, bar chart from hospital earnings to patient totals, and intake by category.
    Add to Wishlist
    Download
    AI Customize
    Slide deck of energy dashboards displaying data visualizations like pie charts, bar and line graphs, in green shades.