Try Our Pre-Designed Speedometer PowerPoint Template

Speedometer PowerPoint template with yellow background showing a 70 percent reading, along with 50 and 60 percent gauges.
P.ID : 17064
    295 views
    30 Downloads
    Designer
    Kavitha
    Get Custom Slides by Experts
    Enhance Your Presentations with Add-ins
    Google Slides Add-in
    Access templates directly in Google Slides
    Microsoft PowerPoint Add-in
    Access templates directly in PowerPoint
    GPT Add-on
    AI-powered presentation assistance

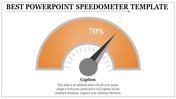
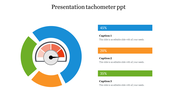
    Editable Speedometer PowerPoint Template

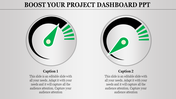
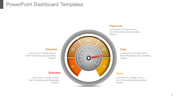
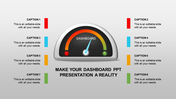
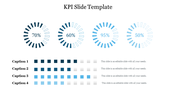
    Introducing our dynamic Speedometer PowerPoint Template. This Slide is your dashboard PPT, complete with sleek speedometers that scream precision. The slide shown in the picture is nothing but a visual masterpiece. It has three different speed indicators, each of which is adjustable to your specific needs. The main speed indicator boldly displays 70%, and Caption 1 below is ready for you to adjust.
    To the right of it are two more speed indicators marked 50% and 60%, each with a customizable title to ensure everyone gets the important information at home for their Employees: Whether you are a marketing expert, economist, or project manager, our speedometer template is your secret weapon for business. Communicate KPIs, sales goals, project milestones, or fair with. Click below to browse or download our templates and Google Slides themes – where innovation meets simplicity, and ideas come to life.

    Features of the template:

    •  Slides are available in 4:3 & 16:9
    • Well-crafted template with instant download.
    • Get slides that are 100% customizable and easy to download
    Advertisement

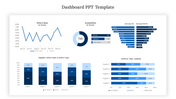
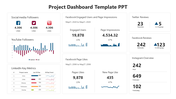
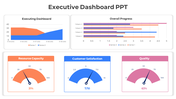
    You May Also Like These PowerPoint Templates

    Free
    Add to Wishlist
    Download
    Edit
    Five-level bar chart executive dashboard with colored blocks labeled with five levels, showing a gradual progression.
    Add to Wishlist
    Download
    Edit
    Modern dashboard PowerPoint template featuring circular progress charts, bar graphs, and key performance metrics.
    Free
    Add to Wishlist
    Download
    Edit
    Bar chart comparing increases and decreases for movies like Avatar and Aquaman, with title logos below.
    Free
    Add to Wishlist
    Download
    Edit
    Colorful project dashboard PPT slide showing a bar chart for four sections with a pie chart detailing percentages.
    Add to Wishlist
    Download
    Edit
    Slide with a revenue chart and metrics for daily, weekly, and yearly sales, along with three user graphs.
    Free
    Add to Wishlist
    Download
    Edit
    Project dashboard with a table containing rows for tasks, dates, and signature for author, client, and manager approval.
    Add to Wishlist
    Download
    Edit
    Business dashboard with progress indicators for promotion, channel management, and revenue metrics.
    Free
    Add to Wishlist
    Download
    Edit
    Colorful dashboard style meters PPT slide with captions and placeholder text.
    Free
    Add to Wishlist
    Download
    Edit
    Dashboard layout featuring a line graph, pie chart, net worth value, and categorized assets and liabilities in green theme.
    Free
    Add to Wishlist
    Download
    Edit
    Executive dashboard slide featuring different vehicles like bike, car, container, train, and plane with title sections.
    Free
    Add to Wishlist
    Download
    Edit
    Executive dashboard template featuring six blue columns with titles and alternating light and dark blue text boxes.