Get Dashboard PPT Template and Google Slides Themes

Speedometer style dashboard template with green, yellow, and red zones for progress tracking with captions.
P.ID : 17956
    315 views
    29 Downloads
    Get Custom Slides by Experts
    Instantly Access Templates in PowerPoint

    Enhance Your Presentations with Dashboard Template


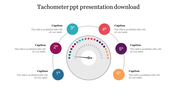
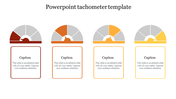
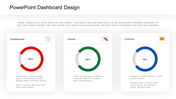
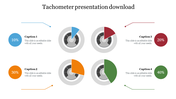
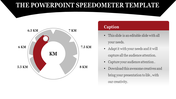
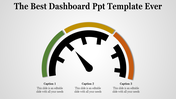
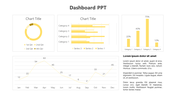
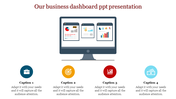
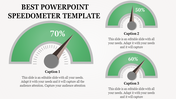
    Our Dashboard PPT Template and Google Slides Themes offer a dynamic way to present your data and insights. This template features an analog meter with three sections, each section equipped with a caption and text area, all set in a vibrant multicolor theme.

    Ideal for business analysts, project managers, and marketing professionals, this template helps visualize performance metrics and key indicators clearly and effectively. Whether you're presenting sales data, project progress, or marketing performance, this template ensures your audience can quickly grasp the key points.

    Customize the slides to fit your specific needs, making it easy to highlight crucial data and trends. The visual appeal and clarity of this template enhance your presentations, making complex data more accessible.

    Features of the template


    • 100% customizable slides are easy to download.
    • Slides are available in different colors.
    • The slide has 4:3 and 16:9 formats.
    • It is easy to change the slide colors quickly.
    • It has a cute design to impress an audience.
    • Create feature-rich, animated presentations.
    Advertisement

    You May Also Like These PowerPoint Templates

    Add to Wishlist
    Download
    AI Customize
    Dashboard slide featuring six sections with graphs and metrics for annual performance in blue and green.
    Add to Wishlist
    Download
    AI Customize
    Effective Dashboard PowerPoint Templates Design
    Add to Wishlist
    Download
    AI Customize
    Dashboard slide with a circular chart in blue shades, featuring percentage labels, and five icons with text on the right.
    Add to Wishlist
    Download
    AI Customize
    Dashboard slide with a pie chart, stacked area chart, and multiple colored rectangular boxes displaying metrics.
    Add to Wishlist
    Download
    AI Customize
    Best Dashboard Sales Performance Reports Revenue Charts
    Add to Wishlist
    Download
    AI Customize
    Dashboard with bar chart comparing planned vs. actual tasks for projects, pie chart for project share, and a line graph displaying project data.
    Add to Wishlist
    Download
    AI Customize
    Gray slide layout with a semicircular gauge in gradient colors of red, orange, and green, and a sidebar with text.
    Add to Wishlist
    Download
    AI Customize
    Circular gauge template with sections in red, orange, yellow, green, and dark green, with captions on either side.
    Add to Wishlist
    Download
    AI Customize
    Infographic dashboard featuring a world map with COVID-19 case data, a gender-based death rate chart, and a pie chart.
    Add to Wishlist
    Download
    AI Customize
    KPI dashboard template PowerPoint slide featuring three sections for data visualization.
    Add to Wishlist
    Download
    AI Customize
    Dashboard layout including a bar chart of company data, a pie chart for quarterly sales distribution.
    Free
    Add to Wishlist
    Download
    AI Customize
    Pie chart in orange, red, green, and blue sections with two text labels on either side, highlighting sales performance.
    Add to Wishlist
    Download
    AI Customize
    Attractive PowerPoint KPI Dashboard Presentation Template
    Add to Wishlist
    Download
    AI Customize
    Dashboard gauge chart PPT template with color coded sections for big loss, loss, break even, profit, and high profit.
    Add to Wishlist
    Download
    AI Customize
    Internet speed dashboard featuring two routers with speed performance indicators and mobile phones.
    Free
    Add to Wishlist
    Download
    AI Customize
    Red-themed circular gauge divided into five sections from direction to business, with a central needle indicator.