Engaging Speedometer Template and Google Slides Themes

 Canva
Canva
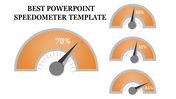
Engaging Speedometer Template and Google Slides Themes
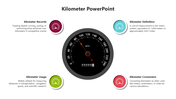
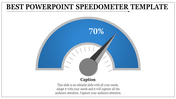
Take your presentations to the next level with our engaging Speedometer template! This template is designed to vividly track the performance and progress of your business, projects, and anything else you set your sights on.
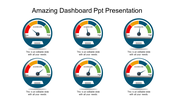
Four clear and informative speedometers, each in a bright and optimistic green, represent key aspects of your work. This allows you to easily gauge progress and stay on top of your goals.
From business growth to project milestones, the Speedometer template makes it easy to visualize your success. The clear and concise design ensures your audience understands your message perfectly, fostering confidence in your achievements.
Whether you're delivering executive briefings, project updates, or performance reviews, this template is your secret weapon for communicating complex information with clarity and impact. Download the Speedometer PowerPoint Template or Google Slides today and watch your presentations soar!
Features of the template
- 100% customizable slides and easy to download.
- Slides are available in different nodes & colors.
- The slide contains 16:9 and 4:3 formats.
- It is easy to change the colors of the slide quickly.
- Well-crafted template with an instant download facility.


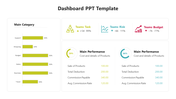
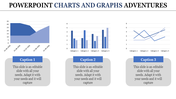
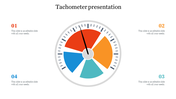
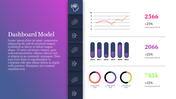
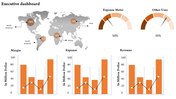
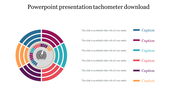
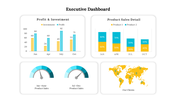
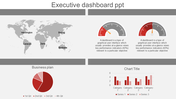
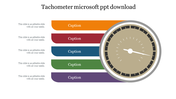
You May Also Like These PowerPoint Templates
Add to Wishlist
Download
Edit

Add to Wishlist
Download
Edit

Add to Wishlist
Download
Edit

Add to Wishlist
Download
Edit


Add to Wishlist
Download
Edit

Add to Wishlist
Download
Edit

Add to Wishlist
Download
Edit

Add to Wishlist
Download
Edit

Add to Wishlist
Download
Edit

Add to Wishlist
Download
Edit

Add to Wishlist
Download
Edit

Add to Wishlist
Download
Edit

Add to Wishlist
Download
Edit

Add to Wishlist
Download
Edit

Add to Wishlist
Download
Edit

Add to Wishlist
Download
Edit

Add to Wishlist
Download
Edit

Add to Wishlist
Download
Edit

Add to Wishlist
Download
Edit
