Get Executive Dashboard PPT Template Slide Designs

Dashboard slide with a world map, two semi circular gauges, a pie chart, and a bar graph in a gray and red theme.
P.ID : 3878
    559 views
    36 Downloads
    Get Custom Slides by Experts
    Instantly Access Templates in PowerPoint

    Executive Dashboard PowerPoint Templates and Google Slides


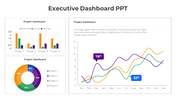
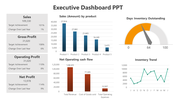
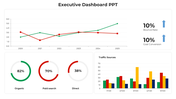
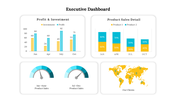
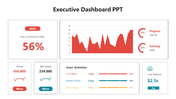
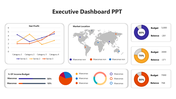
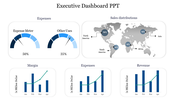
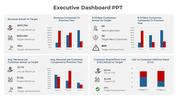
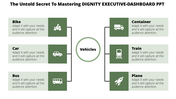
    The Executive Dashboard PowerPoint serves as a powerful tool for conveying key business insights and data to high-level executives. Featuring an executive presentation template, this dashboard incorporates a world map design, four nodes, and professional shade colors to enhance visual appeal. The strategic use of these elements ensures a visually engaging and comprehensive representation of complex business information. This tailored design not only facilitates seamless data interpretation but also aligns with the sophisticated standards required for executive presentations. Ideal for business presentations, the Executive Dashboard PPT with its meticulously crafted design provides a clear, concise, and visually impactful way to communicate critical information to decision-makers.

    Feature of the template


    • 100% customizable slides and easy to download.
    • Slides available in different nodes & colors.
    • The slide is contained in 16:9 and 4:3 format.
    • Easy to change the slide colors quickly.
    • Well-crafted template with instant download facility. 
    Advertisement

    You May Also Like These PowerPoint Templates

    Free
    Add to Wishlist
    Download
    AI Customize
    Free KPI Presentation PPT Template and Google Slides
    Add to Wishlist
    Download
    AI Customize
    Executive Dashboard slide showing key performance metrics such as revenue vs. target, customer acquisition, and CAC vs. CLV.
    Free
    Add to Wishlist
    Download
    AI Customize
    Dashboard template with a circular speedometer gauge in the center, divided into five blue segments labeled 01 to 05.
    Free
    Add to Wishlist
    Download
    AI Customize
    Colorful project dashboard PPT slide showing a bar chart for four sections with a pie chart detailing percentages.
    Add to Wishlist
    Download
    AI Customize
    Data driven financial presentation slide featuring revenue, profit, and customer metrics, along with trend graphs.
    Free
    Add to Wishlist
    Download
    AI Customize
    KPI dashboard bar chart slide representing the height of the world's tallest hills with a world map marking their locations.
    Free
    Add to Wishlist
    Download
    AI Customize
    Dashboard infographic with three gauge meters in blue, green, and yellow, each labeled with a number and caption.
    Add to Wishlist
    Download
    AI Customize
    KPI dashboard slide with line chart, showing performance for four categories, along with circular percentage indicators.
    Add to Wishlist
    Download
    AI Customize
    Speedometer KPI dashboard showing speed readings for three vehicles a truck, a van, and a car.
    Free
    Add to Wishlist
    Download
    AI Customize
    Free KPI PPT Template For Presentation & Google Slides
    Free
    Add to Wishlist
    Download
    AI Customize
    KPI PPT Template with three colourful circular progress charts  showing percentages, growth indicators, and  bar charts.
    Add to Wishlist
    Download
    AI Customize
    KPI dashboard slide showing multiple charts, including bar, line, pie, and gauge charts with tracking business data.
    Free
    Add to Wishlist
    Download
    AI Customize
    KPI Template PPT Presentation Slide With Bar Chart
    Add to Wishlist
    Download
    AI Customize
    KPI slide highlighting essential business metrics alongside color coded sections for quick reference and analysis.
    Add to Wishlist
    Download
    AI Customize
    Key performance indicator slide displaying data bars, percentages, and distinct icons in a structured layout.