Easy To Editable Dashboard PPT Presentation Template


Creative PowerPoint Dashboard Templates and Google Slides
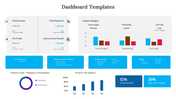
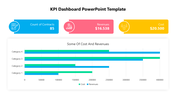
Let your data strut its stuff in royal purple with our PowerPoint dashboard template. Picture this: your numbers, once trapped in spreadsheets, erupt onto the screen in sleek graphs and charts, dancing in a ballet of insights. Three elegant nodes act as spotlights, guiding your audience's gaze to the key stories hidden within. No more data dumps, just captivating visualizations that sing louder than a thousand bullet points.
Present complex analytics? dashboard ppt template whispers clarity. Simplify intricate statistics? It amplifies understanding. This template isn't just a tool, it's a magic trick, transforming dry numbers into dazzling spectacles. Streamline your presentation, captivate your audience, and leave them spellbound by the sheer beauty of your insights. Remember, data has a voice, and with dashboard ppt template, it's about to serenade the room. So ditch the dusty decks and embrace the royal revolution – your data deserves a purple palace, and it awaits.
Features of the template:
- Slides are available in different nodes & colors.
- Easy to change the slide colors.
- Well-crafted template with instant download.
- 100 % customizable slides and easy to download.
- Well-crafted template with instant download.


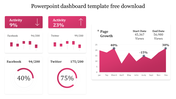
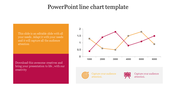
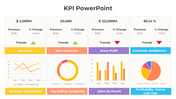
You May Also Like These PowerPoint Templates
Add to Wishlist
Download
AI Customize

Add to Wishlist
Download
AI Customize

Free
Add to Wishlist
Download
AI Customize

Add to Wishlist
Download
AI Customize

Add to Wishlist
Download
AI Customize

Add to Wishlist
Download
AI Customize

Add to Wishlist
Download
AI Customize

Add to Wishlist
Download
AI Customize

Add to Wishlist
Download
AI Customize

Add to Wishlist
Download
AI Customize

Add to Wishlist
Download
AI Customize

Add to Wishlist
Download
AI Customize

Add to Wishlist
Download
AI Customize

Add to Wishlist
Download
AI Customize

Add to Wishlist
Download
AI Customize

Add to Wishlist
Download
AI Customize

Add to Wishlist
Download
AI Customize

Add to Wishlist
Download
AI Customize

Add to Wishlist
Download
AI Customize

Free
Add to Wishlist
Download
AI Customize
