Best Speedometer PPT Download Presentation

Ten speedometer icons in two rows, each with blue, green, and red segments, ranging from 0 to 100.
P.ID : 61234
    473 views
    75 Downloads
    Get Custom Slides by Experts
    Instantly Access Templates in PowerPoint

    Creative Speedometer PowerPoint Presentation Templates 


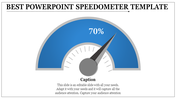
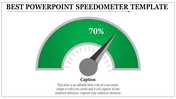
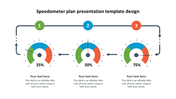
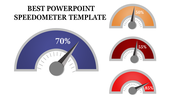
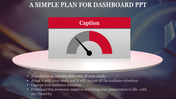
    Download this Speedometer PPT Download PowerPoint presentation template for some creative presentation slides. This Speedometer PPT Download PowerPoint presentation template comes with ten images of the speedometer. You can enter the name of each node at the bottom of it. This template is so creative and gives a satisfying and amazing look to your presentation slides. 

    This type of PowerPoint presentation template is highly customizable and easily editable and so it will save your most valuable time and resources to a very large extent and so download this PPT template and reap the greatest benefits of all.

    Features of this template:

    • 100% customizable slides and easy to download. 
    • Slides available in different nodes and colors. 
    • The slide contained 16:9 and 4:3 format.
    • Easy to change the slide colors quickly. 
    • It is a well-crafted template with an instant download facility. 
    • Saves time.
    • Easy accessible and user-friendly.
    Advertisement

    You May Also Like These PowerPoint Templates

    Add to Wishlist
    Download
    AI Customize
    Project overview dashboard template with area chart, line charts for time intervals, and percentage indicators.
    Add to Wishlist
    Download
    AI Customize
    Colorful Tachometer slide with color coded sections from light to BMI with placeholder text.
    Add to Wishlist
    Download
    AI Customize
    Slide with three tachometer dials in blue, purple, and pink, each aligned above a matching caption box.
    Add to Wishlist
    Download
    AI Customize
    Dashboard graphics displaying vehicle speeds with a data table listing vehicles, brands, and status.
    Add to Wishlist
    Download
    AI Customize
    Project dashboard slides with Gantt chart, a burndown chart, and a timeline, using a palette of brown, green, and red.
    Add to Wishlist
    Download
    AI Customize
    Tachometer PowerPoint slide with gauges indicating 10, 20, and 30 with captions for each.
    Free
    Add to Wishlist
    Download
    AI Customize
    Dashboard with a timeline bar chart in green and purple, labeled with milestones for savings and investments.
    Add to Wishlist
    Download
    AI Customize
    Dashboard showing from defect rate trends upto delivery time analysis in mixed orange and brown theme.
    Add to Wishlist
    Download
    AI Customize
    KPI slide with four semi circular gauges displaying metrics and overlapping colored circles showing numerical data.
    Add to Wishlist
    Download
    AI Customize
    KPI dashboard layout with bar charts, a gauge, captions, and target metrics on light gray background, organized in sections.
    Add to Wishlist
    Download
    AI Customize
    Concentric pentagons in black with text areas around each corner, forming a simple monochrome layout.
    Add to Wishlist
    Download
    AI Customize
    Horizontal infographic with four tachometer icons in gradient colors, labeled with captions for each gauge.
    Add to Wishlist
    Download
    AI Customize
    Slide featuring a tachometer dial with four performance levels and linked captions in red, yellow, maroon, and blue.
    Add to Wishlist
    Download
    AI Customize
    Dashboard layout with charts in orange tones, including a donut chart, bar graphs, and a line chart for monthly data.
    Add to Wishlist
    Download
    AI Customize
    Slide with four red speedometers, each indicating a different percentage level, against a white background.
    Add to Wishlist
    Download
    AI Customize
    Cash flow dashboard with a vertical bar chart and two horizontal stacked bar charts detailing revenue categories.