Effective KPI Template PowerPoint Presentation Design

Colorful infographic with a line graph, pie and bar chart, and numerical data panels in a structured KPI template design.
P.ID : 35539
    956 views
    91 Downloads
    Get Custom Slides by Experts
    Instantly Access Templates in PowerPoint

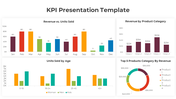
    KPI Presentation Template

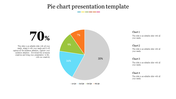
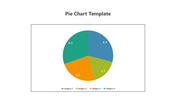
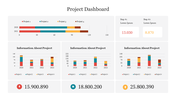
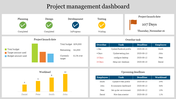
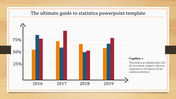
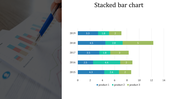
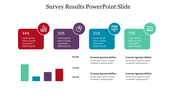
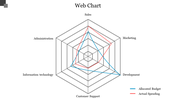
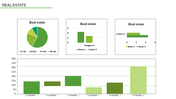
    KPI is a concise way to understand how your business is doing. Our Simple KPI PowerPoint Template is ideal for senior executives who want to visualize their company's performance in a clear and concise way. It features a bar and line graph of key KPIs and pie charts of related statistics. You can do a visual depiction of your company's goals and objectives with these eight nodded slides. If you're a marketing or sales personnel, use it to present your company's goals and objectives visually.

    Features of the template

    • 100% customizable slides and easy to download.
    • Slides are available in different nodes & colors.
    • The slide contained 16:9 and 4:3 formats.
    • Easy to change the slide colors quickly.
    • Well-crafted template with instant download facility.
    • Ideal slide for KPI ideas.
    • Easy way to picture your facts.
    Advertisement

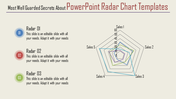
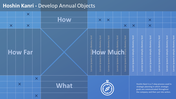
    You May Also Like These PowerPoint Templates

    Add to Wishlist
    Download
    AI Customize
    Speedometer clipart slide featuring three gauges at 25%, 50%, and 75% with space for descriptive text below each.
    Free
    Add to Wishlist
    Download
    AI Customize
    KPI slide displaying key performance indicators with many sections and accompanying data charts.
    Add to Wishlist
    Download
    AI Customize
    Change curve diagram mapping emotional responses over time, with stages from shock and denial along a wavy line.
    Add to Wishlist
    Download
    AI Customize
    Dashboard slide showcasing project management KPIs with bar graphs, a line graph, and a pie chart in different colors.
    Add to Wishlist
    Download
    AI Customize
    Innovative Cockpit Charts PowerPoint Download PPT Slides
    Add to Wishlist
    Download
    AI Customize
    Project management dashboard with charts for budget, progress, risks, workload, and projected launch date and icons.
    Add to Wishlist
    Download
    AI Customize
    PowerPoint slide with KPI dashboard metrics, including revenue, sales by month, and customer revenue comparison.
    Add to Wishlist
    Download
    AI Customize
    A line chart  slide showing data trends across seven items with two percentage indicators with icons and caption areas.
    Free
    Add to Wishlist
    Download
    AI Customize
    KPI Dashboard with bubbles for sales, attendance, download, and report and a client location legend.
    Add to Wishlist
    Download
    AI Customize
    Color coded timeline chart slide showing tasks over 10 months, from june 2019 to february 2020, with labeled milestones.
    Add to Wishlist
    Download
    AI Customize
    Bar chart slide showing data trends from 2016 to 2021 with three categories, highlighted in red, teal, and yellow bars.
    Add to Wishlist
    Download
    AI Customize
    KPI Training slide featuring a social media analysis table with metrics for followers, mentions, interactions, and shares.
    Add to Wishlist
    Download
    AI Customize
    Task management dashboard slide showing task numbers and completion percentages with colored gauge icons.
    Add to Wishlist
    Download
    AI Customize
    Pricing Strategy chart slide highlighting four key areas from price to promotion with icons in a diamond layout.
    Add to Wishlist
    Download
    AI Customize
    Circular progress bar with four colorful concentric rings and percentage labels, surrounded by text areas.
    Add to Wishlist
    Download
    AI Customize
    Revenue dashboard with bar charts, statistics, and sliders showing data metrics in various colors.
    Add to Wishlist
    Download
    AI Customize
    Editable Speedometer PowerPoint Template Presentation
    Add to Wishlist
    Download
    AI Customize
    KPI slide highlighting essential business metrics alongside color coded sections for quick reference and analysis.