Editable Dot Charts PowerPoint Template For Presentation

Editable Dot Charts PowerPoint Template For Presentation
P.ID : 56012
    281 views
    23 Downloads
    Get Custom Slides by Experts
    Instantly Access Templates in PowerPoint

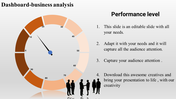
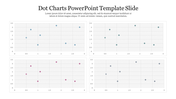
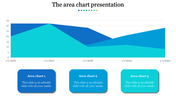
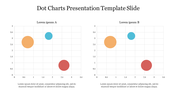
    Dot Charts Presentation Slide

    Dot Charts are a type of graph that display data points as dots on a horizontal and vertical axis. These charts are useful for visualizing and comparing data sets, particularly when there are many data points. The dots can be color-coded or sized to represent different variables, adding an extra layer of information to the chart. Dot Charts are commonly used in fields such as finance, healthcare, and research. This template can be used to create professional and visually appealing Dot Charts for presentations or reports, making it easier to communicate complex data in a clear and concise manner.


    Features of the template:

    • 100% customizable slide and easy to download. 
    • The slide contained in 16:9 and 4:3 formats.
    • This slide has a colorful design pattern.
    • Highly compatible with PowerPoint and Google Slides.
    • Drag and drop image placeholder.
    • Well-crafted template with instant download facility.
    • Creative design with vibrant colors.
    • Three nodes with text area.
    Advertisement

    You May Also Like These PowerPoint Templates

    Add to Wishlist
    Download
    AI Customize
    Timeline chart template showing tasks across four years with segmented bars in yellow, red, and purple.
    Add to Wishlist
    Download
    AI Customize
    PowerPoint slide featuring four bar charts with different colors and captions, each representing different data percentages.
    Add to Wishlist
    Download
    AI Customize
    Scatter plot with differently sized bubbles in orange and purple, with a legend and product descriptions to the side.
    Add to Wishlist
    Download
    AI Customize
    Green color KWL chart presentation template with sections for What I Know, What I Want to Know, and What I Learned.
    Add to Wishlist
    Download
    AI Customize
    Yearly loss chart with six green bars and a line graph illustrating trends from 2014 to 2019.
    Add to Wishlist
    Download
    AI Customize
    Mekko chart displaying monthly data in sections, with colors indicating different categories from January to December.
    Add to Wishlist
    Download
    AI Customize
    KWL chart slide with three light gray boxes, featuring maroon headers and side labels for knowledge tracking.
    Add to Wishlist
    Download
    AI Customize
    3D bar chart with four vertical bars in blue, teal, purple, and yellow, with percentage labels and captions for each.
    Add to Wishlist
    Download
    AI Customize
    Executive dashboard slide displaying project details including start date, deadline, team members, and activities.
    Add to Wishlist
    Download
    AI Customize
    Slide with three charts, each having four bars in green, pink, yellow, and blue, with text below.
    Add to Wishlist
    Download
    AI Customize
    KWL Chart Infographics PPT Template For Presentation
    Add to Wishlist
    Download
    AI Customize
    Green themed dashboard template with three plant growth in line, bar and area chart for different years and species.
    Free
    Add to Wishlist
    Download
    AI Customize
    Slide with a circular chart and two bars, highlighted in red, with progress indicator and explanatory text beside.
    Add to Wishlist
    Download
    AI Customize
    Dashboard template with two horizontal bar charts, a calendar icon, and circular progress indicators in orange and green.
    Add to Wishlist
    Download
    AI Customize
    Pie chart on the left with four colored sections and percentages, alongside steps with matching colors on the right.