Free - Pie Chart Template Free Download PPT And Google Slides

Free
Pie Chart Template Free Download PPT And Google Slides
P.ID : 4249
    2K+ views
    365 Downloads
    Get Custom Slides by Experts
    Instantly Access Templates in PowerPoint

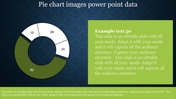
    Circular Pie Chart Template Free Download PPT


    The pie chart template free download for PowerPoint and Google Slides, which easily represents a resourceful display of data in an appealing way.

    Facts And Introduction:

    The pie chart, invented by William Playfair as far back as 1801, shows proof regarding data proportionality because of its circular structure. Pie charts have been a part of PowerPoint since the presentation's old versions and help in making involved data easier to represent for clear and powerful presentations.

    Slide Description:

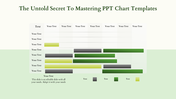
    The template contains a round pie chart split up into four differently colored sections with their number label and color keys to the bottom for easy representation of data.

    Purpose of the Slide:

    The purpose of this slide is to illustrate to your audience how your data is divided into four distinct sections. When you want people to be able to compare or show proportions, this is an ideal tool that will let your audience grasp information with ease.

    Who can benefit?

    This is going to be an excellent template for market researchers, teachers, and project managers. Whatever you have to present, be it market share, survey results, or how the project is divided, trust that your data will be properly presented.

    Download this Free Pie Chart template today.

    Features of the template


    • 100% customizable slides and easy to download.
    • The slides contain 16:9 and 4:3 formats.
    • Easy to change the colors quickly.
    • It is a well-crafted template with an instant download facility.
    • It is a 100% pre-designed slide.
    • The slide holds vibrant colors.
    Advertisement

    You May Also Like These PowerPoint Templates

    Add to Wishlist
    Download
    AI Customize
    Chart slide showing monthly bar graphs split into two sections and pie charts highlighting four color-coded items.
    Add to Wishlist
    Download
    AI Customize
    Executive dashboard with four blue horizontal boxes containing text and a smiling cartoon man gesturing on the right.
    Add to Wishlist
    Download
    AI Customize
    Wheel shaped infographic with six labeled stages and captions extending outwards, centered around a handshake symbol.
    Add to Wishlist
    Download
    AI Customize
    Dashboard with a multi-colored semicircular gauge divided into four sections, labeled 01 to 04, and captions on the right.
    Add to Wishlist
    Download
    AI Customize
    Timeline chart slide displaying key dates and durations from July 2018 to October 2021 with placeholder text.
    Add to Wishlist
    Download
    AI Customize
    Business analysis dashboard with a bar chart and an illustrated man holding a pointer in a dark background.
    Add to Wishlist
    Download
    AI Customize
    PowerPoint Chart Template And Google Slides-Three Node
    Free
    Add to Wishlist
    Download
    AI Customize
    Four cylindrical blue bars in a row next to a woman in a black suit in a simple design layout.
    Add to Wishlist
    Download
    AI Customize
    Dashboard slide with a speedometer gauge in red, blue, yellow, and teal, and text bullet points on the left.
    Add to Wishlist
    Download
    AI Customize
    Green themed diagram illustrating stages of analysis delivery, from data source to client reports and dashboards.
    Add to Wishlist
    Download
    AI Customize
    A slide showcasing four different chart types from Column Histogram to Scatter Plot with corresponding data.
    Free
    Add to Wishlist
    Download
    AI Customize
    Green bar chart PowerPoint slide with percentages for the years 2017 through 2021 and a woman standing next to the chart.
    Add to Wishlist
    Download
    AI Customize
    Project summary dashboard showing project statistics, budget, actual performance, and project performance by category.
    Add to Wishlist
    Download
    AI Customize
    Sashboard design featuring three plant species data and corresponding progress meters in red, green, and blue.
    Add to Wishlist
    Download
    AI Customize
    Green circular chart with five segments labeled by categories and percentages, with descriptions around it.
    Add to Wishlist
    Download
    AI Customize
    Chart PPT template showing 4 progress circles with percentages and color coded sections for Blue, Green, Yellow, and Orange.
    Add to Wishlist
    Download
    AI Customize
    Dashboard layout with bar, pie, and stacked charts in yellow, orange, red, and green on a white background.
    Add to Wishlist
    Download
    AI Customize
    3D bar chart infographic showing four blocks in blue, green, red, and orange with percentages and captions.