Colorful Survey Results PowerPoint Slide

Slide showcasing survey data with percentage figures in colored text boxes and icons with a comparative bar chart.
P.ID : 55222
    1.5K+ views
    203 Downloads
    Get Custom Slides by Experts
    Instantly Access Templates in PowerPoint

    Informative Slide For Your Survey Reports

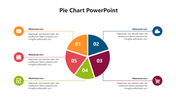
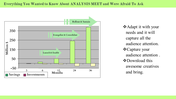
    Looking for a pre-designed slide to present the summary of your business survey report? Your hunting is over here. Download this professionally drafted survey results PPT slide from SlideEgg to present your report precisely. It is a four-noded slide with charts, icons, and text blocks in multicolor to quickly analyze your survey report. It is a highly efficient slide and provides you with the freedom of customization. It will help the business people to understand the customer requirements, business performances,  etc. It is also helpful to present the facts on places or people accumulated in censuses, surveys, and administrative records. Get this versatile slide today!

    Features of the template

    • 100% customizable slides and easy to download.
    • Slides are available in different nodes & colors.
    • The slide contains 16:9 and 4:3 formats.
    • Easy to change the colors of the slide quickly.
    • Well-crafted template with an instant download facility.
    • Four noded slides with charts and icons.
    Advertisement

    You May Also Like These PowerPoint Templates

    Add to Wishlist
    Download
    AI Customize
    Dark themed layout featuring four pie charts with shaded segments, each displaying different percentages.
    Add to Wishlist
    Download
    AI Customize
    Cash flow dashboard with a vertical bar chart and two horizontal stacked bar charts detailing revenue categories.
    Add to Wishlist
    Download
    AI Customize
    Dashboard with four bar charts in yellow, green, teal, and red, comparing project risks and change requests.
    Add to Wishlist
    Download
    AI Customize
    Project Gantt chart with task descriptions, percentage completion, and horizontal progress bars.
    Add to Wishlist
    Download
    AI Customize
    Three circular dashboard dials with red, blue, and brown segments, each containing captions below.
    Add to Wishlist
    Download
    AI Customize
    Slide featuring a dashboard with three dials labeled Low, Mid, and High, indicating various levels of measurement.
    Add to Wishlist
    Download
    AI Customize
    Slide with pie charts, line graphs, and a bar chart in shades of green, illustrating data trends and comparisons.
    Free
    Add to Wishlist
    Download
    AI Customize
    PowerPoint slide showcasing projected cash flows, NPV for 3 and 5 years, and payback period with client testimonial.
    Add to Wishlist
    Download
    AI Customize
    Six month Gantt chart with bars in blue, green, red, orange, and teal, arranged for task tracking.
    Free
    Add to Wishlist
    Download
    AI Customize
    Infographic of a bar chart representing yearly growth from 2018 to 2021 with a businesswoman illustration.
    Add to Wishlist
    Download
    AI Customize
    Circular pie chart divided into five colored sections noted with percentages, with corresponding boxes for text area.
    Add to Wishlist
    Download
    AI Customize
    Three panel dashboard with column, bar, and funnel charts at the top and numbered blue boxes with text below.
    Free
    Add to Wishlist
    Download
    AI Customize
    KPI dashboard layout with blue semicircle gauges and line charts representing social media performance metrics.
    Add to Wishlist
    Download
    AI Customize
    Dashboard-themed slide with semi-circle charts for business analysis, featuring metrics and reflective silhouettes at the bottom.
    Add to Wishlist
    Download
    AI Customize
    Bar chart infographic with four blue bars for kpi forecasts, a line graph overlay, and a man with a magnifying glass.
    Add to Wishlist
    Download
    AI Customize
    Executive dashboard slide featuring bar graphs and pie charts comparing project data over three years, with text boxes.