Change Curve Graphics PowerPoint Template For You

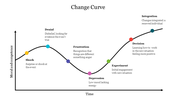
Change Curve Graphics PowerPoint Template
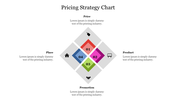
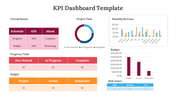
Download this multicolored connective graph inserted template to discuss essential topics required for an efficient discussion or conference. The nodes in the graph carry captions that talk about shock, frustration, denial, etc. The captions can be related to explain psychological elements as well. Many attributes are loaded in this template that gains a lot of attention.
So, don't delay and get this downloaded now!
Features of this template
- 100% customizable slides and easy to download
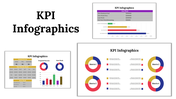
- Slides are available in different nodes & colors.
- The slides contained 16:9 and 4:3 formats.
- Easy to change the slide colors quickly.
- Well-crafted template with instant download facility.
- Crisp and elegant font style.
- The best template with attractive nodes.


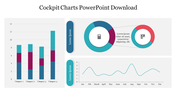
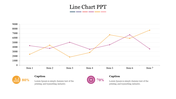
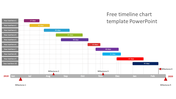
You May Also Like These PowerPoint Templates
Free
Add to Wishlist
Download
AI Customize

Add to Wishlist
Download
AI Customize

Add to Wishlist
Download
AI Customize

Add to Wishlist
Download
AI Customize

Add to Wishlist
Download
AI Customize

Add to Wishlist
Download
AI Customize

Add to Wishlist
Download
AI Customize

Add to Wishlist
Download
AI Customize

Add to Wishlist
Download
AI Customize

Free
Add to Wishlist
Download
AI Customize

Add to Wishlist
Download
AI Customize

Add to Wishlist
Download
AI Customize

Add to Wishlist
Download
AI Customize

Free
Add to Wishlist
Download
AI Customize

Add to Wishlist
Download
AI Customize

Add to Wishlist
Download
AI Customize

Add to Wishlist
Download
AI Customize

Add to Wishlist
Download
AI Customize

Add to Wishlist
Download
AI Customize

Free
Add to Wishlist
Download
AI Customize
