MILESTONE 🌟 5 Million+ creative minds trust SlideEgg! Grab 80% OFF

Best Web Chart PowerPoint Presentation Template Slide

Hexagonal web chart with blue and red lines showing financial data for six business areas at the corners.
P.ID : 59246
    400 views
    58 Downloads
    Get Custom Slides by Experts
    Instantly Access Templates in PowerPoint

    Eight Noded Web Chart Presentation Slide


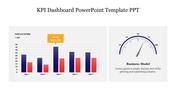
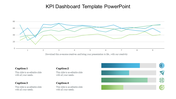
    Download Now! Web Chart PowerPoint Template is an attractive, professional-looking presentation tool. It is a perfect way to show the comparison of allocated budget and actual spending. This template can be edited to suit your preferences. It is compatible with Microsoft PowerPoint, Apple Keynote, and Google Slides. The templates are fully customizable so that you can use them without any difficulty. 

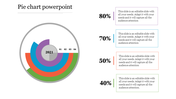
    The Web Chart PowerPoint Template is designed with circular and elegant spiral shapes PowerPoint. It is designed like a spider web. The six stages of the process are described in this eight-noded template. Using this template, you can present sales, marketing, development, customer support, information technology, and administration. The shapes can be resized or rotated to fit your design. 

    Features of this template:

    1. 100% customizable slides and easy to download.
    2. Slides available in different nodes & colors.
    3. The slide contained 16:9 and 4:3 format.
    4. Easy to change the slide colors quickly.
    5. Well-crafted template with instant download facility.
    6. A creative slide with perfect designs.
    Advertisement

    You May Also Like These PowerPoint Templates

    Free
    Add to Wishlist
    Download
    AI Customize
    Gantt chart slide showing six tasks with progress bars, each reflecting completion levels ranging from 30% to 80%.
    Add to Wishlist
    Download
    AI Customize
    Four orange pie charts with center numbers from 01 to 04, each with text placeholders on the right.
    Add to Wishlist
    Download
    AI Customize
    Microsoft PowerPoint slide featuring three donut charts in yellow, orange, and pink, each with different percentage values.
    Add to Wishlist
    Download
    AI Customize
    Horizontal Gantt chart with blue bars representing tasks, timeline from March to April 2020, and gray grid lines.
    Free
    Add to Wishlist
    Download
    AI Customize
    Line chart template with two data series on a dark background, featuring a calculator and pen in the background.
    Add to Wishlist
    Download
    AI Customize
    KPI Dashboard PPT slide displaying project analysis, revenue, profitability, and gap analysis with data visualizations.
    Add to Wishlist
    Download
    AI Customize
    Business KPI dashboard showcasing charts for real estate and page views with pie, bar, and line graph visualizations.
    Add to Wishlist
    Download
    AI Customize
    Colorful infographic with a line graph, pie and bar chart, and numerical data panels in a structured KPI template design.
    Add to Wishlist
    Download
    AI Customize
    Dashboard template showing sales, orders, visitors, and users metrics with visual bar and pie charts for website analysis.
    Add to Wishlist
    Download
    AI Customize
    Professional setting with pie charts showing task distribution in red tones for analysis, collection, and development.
    Add to Wishlist
    Download
    AI Customize
    Project overview dashboard template with area chart, line charts for time intervals, and percentage indicators.
    Add to Wishlist
    Download
    AI Customize
    Gradient peaks showing sales growth percentages in shades of blue and gray, with detailed text on the right dark sidebar.
    Add to Wishlist
    Download
    AI Customize
    Slide featuring a blue-toned pie chart representing sales revenue percentages, with captions areas for each segment.
    Add to Wishlist
    Download
    AI Customize
    Row of pie charts with varying color schemes for data visualization each place diwth caption areas.
    Add to Wishlist
    Download
    AI Customize
    Dashboard chart displaying social media subscribers by gender, age, most read articles, and categories in 2019.
    Add to Wishlist
    Download
    AI Customize
    Three pie charts in red, yellow, and blue with percentage values, arranged horizontally with text below.
    Add to Wishlist
    Download
    AI Customize
    Six-month Gantt chart template spanning July to December 2020 with weekly divisions and task rows.