Pie chart PPT Presentation Template and Google Slides Themes

A pie chart broken into four colored sections with percentages, labeled by quarters, and descriptive placeholder text areas.
P.ID : 34759
    494 views
    60 Downloads
    Get Custom Slides by Experts
    Instantly Access Templates in PowerPoint

    Pie Chart  Presentation Template


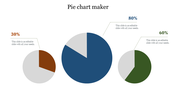
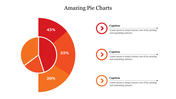
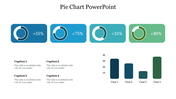
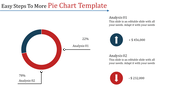
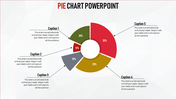
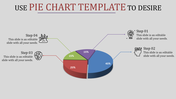
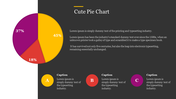
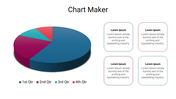
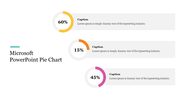
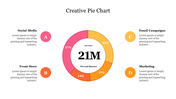
    Ever find it hard to make complex data easy to understand? You're not alone. But imagine if you could show your information in a way that's colourful, clear, and memorable. This pie chart presentation template has four stunning pie charts, each full of bright colors to highlight your key points. With editable captions, you can easily explain the percentages and insights from your data. The clean white background makes everything look professional and modern, ensuring your data stands out.

    Whether you're a student making a presentation, a business professional writing a report, or a teacher explaining tough concepts, this template is perfect for you. Just replace the sample data with your own, adjust the colors and captions to fit your style, and you're ready to impress your audience.  Download this template today and see the difference!

    Features of the template


    • Slides are available in different nodes & colors.
    • Easy to change the slide colors.
    • Well-crafted template with instant download.
    • Highly compatible with PowerPoint and Google Slides.
    Advertisement

    You May Also Like These PowerPoint Templates

    Add to Wishlist
    Download
    AI Customize
    KPI dashboard slide with line chart, showing performance for four categories, along with circular percentage indicators.
    Add to Wishlist
    Download
    AI Customize
    Speedometer KPI dashboard showing speed readings for three vehicles a truck, a van, and a car.
    Add to Wishlist
    Download
    AI Customize
    Template showcasing various chart designs, including line, bar, pie, and comparison charts across multiple slides.
    Add to Wishlist
    Download
    AI Customize
    Creative charts showing a circular 60% approval metric, bar graphs, and a 55% Twitter engagement donut chart.
    Free
    Add to Wishlist
    Download
    AI Customize
    PPT slide with a yellow bar chart showing percentages for the years 2016 to 2021 with a woman standing next to the chart.
    Free
    Add to Wishlist
    Download
    AI Customize
    Gantt chart plan template showing tasks across months with a colorful circular pie chart and matching bars on theright.
    Free
    Add to Wishlist
    Download
    AI Customize
    Bar chart comparing metrics over years alongside a diagram linking manager, idea, and management to business growth.
    Add to Wishlist
    Download
    AI Customize
    Project schedule slide with a Gantt chart displaying tasks, timelines, and completion percentages.
    Free
    Add to Wishlist
    Download
    AI Customize
    Green pie chart divided into four labeled sections, showing percentage values with text annotations.
    Add to Wishlist
    Download
    AI Customize
    Progress chart slide showing four colorful circular charts labeled from business to report with varying percentages and text.
    Add to Wishlist
    Download
    AI Customize
    Three segment pie chart in shades of red and orange with percentages, aligned next to three captions on the right.
    Add to Wishlist
    Download
    AI Customize
    Colorful pie chart slide showing five distinct stages with varying percentage values each with numbered placeholder text.
    Free
    Add to Wishlist
    Download
    AI Customize
    A pie chart slide is divided into five colorful sections and icons, each with a number and connected to descriptive captions.
    Free
    Add to Wishlist
    Download
    AI Customize
    Smart pie chart with five segments in different colors, displaying percentages, with three placeholder text to the right.
    Free
    Add to Wishlist
    Download
    AI Customize
    Five part pie chart slide illustrating crucial company processes, each section numbered and color coded.
    Free
    Add to Wishlist
    Download
    AI Customize
    Four circular progress graphs in blue, orange, red, and green, each showing percentages and captions.
    Add to Wishlist
    Download
    AI Customize
    Pie chart with five colored segments and a list of matching color-coded labels on the right, each with icons.