Affordable PowerPoint Chart Template Slides


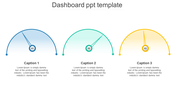

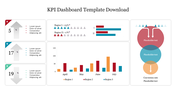
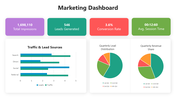
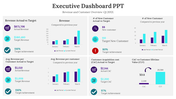
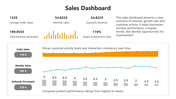
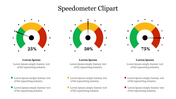
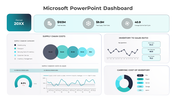
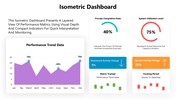
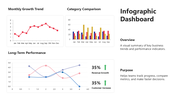


Chart PowerPoint Template and Google Slides Themes
Upgrade your presentations with our "Chart PowerPoint Template and Google Slides Themes." Each slide features graphical nodes with captions, titles, and text areas for clear insights, perfect for analysts, educators, and business leaders. Transform your data into engaging stories, guiding your audience through complex information effortlessly.
Unlike traditional charts, this template brings your data to life, ensuring impact and comprehension. Improve your reports with dynamic visuals and captivate your audience with compelling narratives. Say hello to a new era of storytelling and make your data shine with "Chart PowerPoint Template and Google Slides Themes" today!
Download now and empower your narrative with dynamic nodes and captivating visuals. Engage, inform, and inspire with every slide.
Features of the Template
- 100 % customizable slides.
- The slide show is in 4:3, 16:9, zip format.
- There is powerful connectivity with Google Slides and PowerPoint.
- It is simple and quick to alter the slide's color.
- An efficient template that can be easily accessed immediately.
- Well-crafted template with an instant download facility.


You May Also Like These PowerPoint Templates


Add to Wishlist
Download

Add to Wishlist
Download
Edit


Add to Wishlist
Download
Edit

Add to Wishlist
Download
Edit

Add to Wishlist
Download
Edit

Add to Wishlist
Download
Edit

Add to Wishlist
Download
Edit

Add to Wishlist
Download
Edit


Add to Wishlist
Download
Edit

Add to Wishlist
Download
Edit


