Amazing KPI Dashboard Template PowerPoint

Business KPI dashboard showcasing charts for real estate and page views with pie, bar, and line graph visualizations.
P.ID : 1646
    1.4K+ views
    66 Downloads
    Get Custom Slides by Experts
    Instantly Access Templates in PowerPoint

    Amazing KPI Dashboard Template

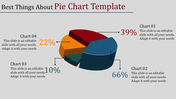
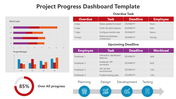
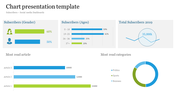
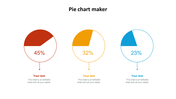
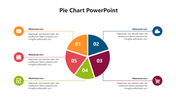
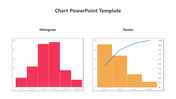
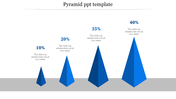
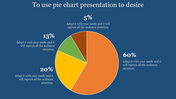
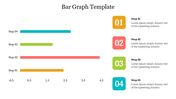
    Do you wish to evaluate the performance of your business? Employ these KPI (Key Performance Indicators). It is an excellent tool for assessing whether you are succeeding in your goals. Use bar or pie charts, pyramids, tables, percentages, maps, or other visual representations to show information about your actions, strategies, or productivity. They have many blocks and a flat design, but there are also some 3D features. Fully editable is the notable feature of this template. Why are you waiting? Just go for it.

    Features of the Template

    • 100% customizable slides and easy to download.
    • Slides are available in different nodes & colors.
    • The slide contains 16:9 and 4:3 formats.
    • Easy to change the colors of the slide quickly.
    • Well-crafted template with an instant download facility.
    • Business performance management.
    • Effective creation.
    Advertisement

    You May Also Like These PowerPoint Templates

    Add to Wishlist
    Download
    AI Customize
    Slide with two donut charts displaying values and a text section on the right with a blurred background image.
    Add to Wishlist
    Download
    AI Customize
    Stacked column chart template displaying proportional data distribution across four categories using three series.
    Add to Wishlist
    Download
    AI Customize
    Colorful circular diagram slide illustrating four corporate strategy methods with labels and percentages.
    Add to Wishlist
    Download
    AI Customize
    KWL chart with sections  in blue, green, and red, each column containing placeholder text.
    Add to Wishlist
    Download
    AI Customize
    Vertical bar chart in red shades, displaying yearly data from 2017 to 2020, with detailed labels on the right.
    Add to Wishlist
    Download
    AI Customize
    Dark themed layout featuring four pie charts with shaded segments, each displaying different percentages.
    Add to Wishlist
    Download
    AI Customize
    Green shaded bar chart displaying data from 2016 to 2021, with three numbered captions below.
    Add to Wishlist
    Download
    AI Customize
    Chart slide showing market supply data from 2004 to 2014 with red bars and percentage annotations.
    Add to Wishlist
    Download
    AI Customize
    Dashboard with four bar charts in yellow, green, teal, and red, comparing project risks and change requests.
    Add to Wishlist
    Download
    AI Customize
    Slide with pie charts, line graphs, and a bar chart in shades of green, illustrating data trends and comparisons.
    Free
    Add to Wishlist
    Download
    AI Customize
    Infographic of a bar chart representing yearly growth from 2018 to 2021 with a businesswoman illustration.
    Add to Wishlist
    Download
    AI Customize
    Circular pie chart divided into five colored sections noted with percentages, with corresponding boxes for text area.
    Free
    Add to Wishlist
    Download
    AI Customize
    3D bar chart PowerPoint template showcasing data in four colored categories with a highlight and captions.
    Free
    Add to Wishlist
    Download
    AI Customize
    Horizontal chart with dual color bars in green and blue, displaying percentage values, and two captions on the right.
    Add to Wishlist
    Download
    AI Customize
    Slide with a vertical bar chart and four labeled sections, each paired with a unique color and icon.
    Free
    Add to Wishlist
    Download
    AI Customize
    A blue themed slide featuring a multi year bar chart comparison from 2016 to 2021 with three placeholders below.
    Free
    Add to Wishlist
    Download
    AI Customize
    3D chart with five colored bars in gold, red, green, teal, and orange, on individual bases, displaying percentages above.
    Add to Wishlist
    Download
    AI Customize
    Innovative KWL Chart PowerPoint Presentation Slide