Multiple Chart Presentation Template and Google Slides


Multiple Chart Presentation Template and Google Slides
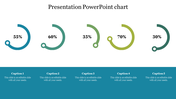
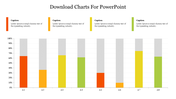
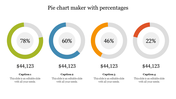
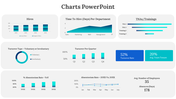
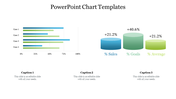
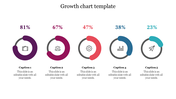
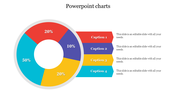
The Chart PowerPoint template and Google Slides theme provide a clear and professional way to summarize your analysis and calculations about population data. Featuring five types of charts - bar charts, line graphs, pie charts, and more. This template simplifies complex data for your audience.
Blue and green colors are used to enhance clarity and make the information visually appealing. Whether you're presenting demographic trends, population growth projections, or statistical analysis, this template offers a versatile platform to showcase your findings.
With a clean and modern design, this template ensures your audience can easily understand and interpret the presented data. Fully customizable, users can adjust colors, fonts, and layout elements to suit their specific needs and preferences.
Whether used for academic presentations, business reports, or public policy discussions, the Chart template provides a comprehensive and impactful tool for communicating population data effectively.
Features of the template
- 100% customizable slides and easy to download.
- Slides are available in different nodes & colors.
- The slide contains 16:9 and 4:3 formats.
- It is easy to change the colors of the slide quickly.
- Well-crafted template with an instant download facility.


You May Also Like These PowerPoint Templates
Add to Wishlist
Download
Edit


Add to Wishlist
Download
Edit


Add to Wishlist
Download
Edit


Add to Wishlist
Download
Edit


Add to Wishlist
Download
Edit


Add to Wishlist
Download
Edit


Add to Wishlist
Download
Edit

Add to Wishlist
Download
Edit


