Pre Designed Pie Chart PowerPoint And Google Slides

Slide featuring a blue-toned pie chart representing sales revenue percentages, with captions areas for each segment.
P.ID : 31998
    224 views
    11 Downloads
    Get Custom Slides by Experts
    Instantly Access Templates in PowerPoint

    Stunning Pie Chart PowerPoint Presentation


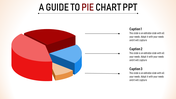
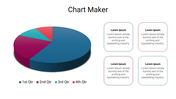
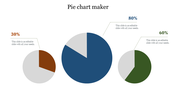
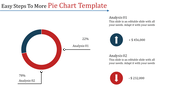
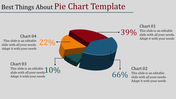
    Ever feel like your hand-drawn pie charts look...well, like the pie you stepped on? This pre-designed pie chart PowerPoint template is your secret weapon for presentations that impress!

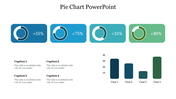
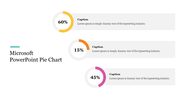
    Imagine a beautiful, blue pie chart (with room for 4 slices) that you can easily customize with your data. Each slice even has a handy spot for percentages, labels, and extra details.

    No more wasting time fiddling with colors and fonts. This template is perfect for teachers, marketers, analysts – anyone who wants their data to shine! 

    Stop struggling with pie charts. Download this template and become a data whiz today!

    Features of the template


    • 100% customizable slides and easy to download.
    • The slides contain 16:9 and 4:3 formats.
    • Easy to change the colors quickly.
    • It is a well-crafted template with an instant download facility.
    • It is a 100% pre-designed slide.
    • The slide holds vibrant colors.
    Advertisement

    You May Also Like These PowerPoint Templates

    Add to Wishlist
    Download
    AI Customize
    Dashboard showing expense meters, global percentages on a map, and a bar chart visualizing data distribution.
    Add to Wishlist
    Download
    AI Customize
    Slide deck with KPI charts and graphs for business analysis, including financials, HR performance, and customer service.
    Add to Wishlist
    Download
    AI Customize
    KPI dashboard template with a line chart, progress indicators, and bar graphs showing different performance metrics.
    Free
    Add to Wishlist
    Download
    AI Customize
    Project dashboard slide for electricity data with bar graphs showing units and amounts for different categories and months.
    Add to Wishlist
    Download
    AI Customize
    Chart infographic comparing data with orange and blue bars, alongside expense and budget details on the right.
    Add to Wishlist
    Download
    AI Customize
    Horizontal layout featuring five purple icons connected by a bar, with detailed text columns below each step.
    Add to Wishlist
    Download
    AI Customize
    KPI dashboard template with progress bars, pie chart, bar graphs, and workload metrics in a clean blue theme.
    Add to Wishlist
    Download
    AI Customize
    Dashboard slide showing business performance, including technology, accessibility, and security scores with activity graphs.
    Free
    Add to Wishlist
    Download
    AI Customize
    A professional comparison slide featuring horizontal bar graphs displaying various percentages alongside captions with icons.
    Free
    Add to Wishlist
    Download
    AI Customize
    Dashboard with four sections showing charts, icons, and metrics in purple, red, green, and teal.
    Free
    Add to Wishlist
    Download
    AI Customize
    KPI dashboard with percentage stats, bar charts, and flow diagrams in red, blue, and orange representing data trends.
    Add to Wishlist
    Download
    AI Customize
    KPI dashboard slide displaying supplier metrics with colorful pie charts, bar graphs, and a process flow with percentages.
    Add to Wishlist
    Download
    AI Customize
    Company Annual Report slide featuring sections for overview, financial review, team management, and service offerings.
    Free
    Add to Wishlist
    Download
    AI Customize
    Project plan Gantt chart template with timeline, color coded tasks descriptions, and milestones spanning from 2017 to 2019.
    Free
    Add to Wishlist
    Download
    AI Customize
     KPI dashboard featuring colorful graphs, sales metrics, real estate charts, and visitor statistics, in a grid layout.
    Free
    Add to Wishlist
    Download
    AI Customize
    Annual report slide displaying a bar chart with color-coded percentages from 30% to 80% and caption areas.