Editable Chart Template PowerPoint And Google Slides

Stacked column chart template displaying proportional data distribution across four categories using three series.
P.ID : 4309
    220 views
    7 Downloads
    Get Custom Slides by Experts
    Instantly Access Templates in PowerPoint

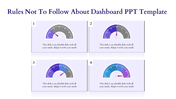
    Four Node Chart Template PPT Presentation 


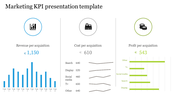
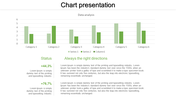
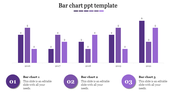
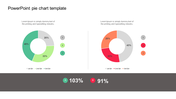
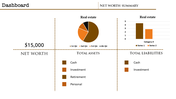
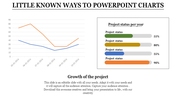
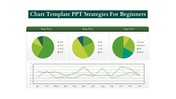
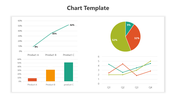
    The chart template PowerPoint and Google Slides have been designed to present complex data in a lucid pictorial form by using 100% stacked column charts. 

    Slide Description:

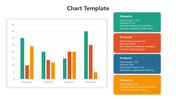
    The template has four images of bar charts with three different colored sections and a color-coded series key at the bottom for easy referencing.

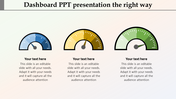
    Purpose of the Slide:

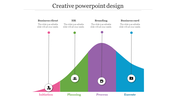
    This slide provides a visual for data categories of their proportion within each column. It is best to show comparative data over multiple categories to show trends.

    Who can benefit?

    In particular, business analysts, data scientists, and educators will extract the most value from this template. Whether you present sales, survey data, or performance metrics, be sure that with this template, the audience will understand it quickly.

    Download Chart template PowerPoint.

    Features of the template


    • 100% customizable slides and easy to download.
    • The slides contain 16:9 and 4:3 formats.
    • Easy to change the colors quickly.
    • It is a well-crafted template with an instant download facility.
    • It is a 100% pre-designed slide.
    • The slide holds vibrant colors.
    Advertisement

    You May Also Like These PowerPoint Templates

    Free
    Add to Wishlist
    Download
    AI Customize
    Green bar graph depicting growth over six months, with two gear icons and captions on the left.
    Add to Wishlist
    Download
    AI Customize
    Slide featuring a 3D bar graph with three series on dark backdrop, a green star shaped badge, and text boxes below.
    Add to Wishlist
    Download
    AI Customize
    Project dashboard slide with a compass design,  featuring four labeled captions, and an orange sidebar for text.
    Add to Wishlist
    Download
    AI Customize
    Donut chart showing sales distribution across four quarters with blue, orange, gray, and yellow segments.
    Free
    Add to Wishlist
    Download
    AI Customize
    Chart slide with four interlinked circular diagrams, and two radar charts in blue and green at the bottom.
    Add to Wishlist
    Download
    AI Customize
    Project risk assessment executive dashboard with four columns and multiple rows, all labeled as placeholder text.
    Free
    Add to Wishlist
    Download
    AI Customize
    Pie chart with four segments in white and green on a dark patterned background, alongside a text box for description.
    Free
    Add to Wishlist
    Download
    AI Customize
    World map infographic surrounded by six segments with icons for business-related captions and caption areas.
    Add to Wishlist
    Download
    AI Customize
    Dashboard slide featuring a stacked bar chart in red, green, and purple, and two speedometer gauge indicators below.
    Add to Wishlist
    Download
    AI Customize
    Slide featuring a financial report with bar charts and a table, showing website and a percentage statistic on the right.
    Free
    Add to Wishlist
    Download
    AI Customize
    Horizontal bar chart with green and gray bars of varying lengths, labeled with placeholder text, on a light background.
    Free
    Add to Wishlist
    Download
    AI Customize
    Pie chart PPT slide with four sections in different colors and percentages, with accompanying text labels for each section.
    Add to Wishlist
    Download
    AI Customize
    KPI dashboard slide with metrics for Visits, Visitors, Conversion rate, and Revenue per user along with views per device.
    Add to Wishlist
    Download
    AI Customize
    Green themed chart layout featuring bar graphs, pie charts, line graphs, and a world map for diverse data visualization.
    Add to Wishlist
    Download
    AI Customize
    Bar chart in PowerPoint displaying data with titles and placeholders for example text and additional information.
    Add to Wishlist
    Download
    AI Customize
    Project comparison table with sections for team members, location, costs, and risk before and after changes.
    Add to Wishlist
    Download
    AI Customize
    Chart slide showing monthly bar graphs split into two sections and pie charts highlighting four color-coded items.
    Add to Wishlist
    Download
    AI Customize
    Executive dashboard with four blue horizontal boxes containing text and a smiling cartoon man gesturing on the right.