Attractive Chart Presentation And Google Slides Themes

Bar chart slide showing the performance of four products with categories like sales growth, market share, and profit margin.
P.ID : 5568
    369 views
    28 Downloads
    Get Custom Slides by Experts
    Instantly Access Templates in PowerPoint

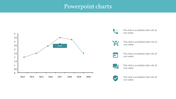
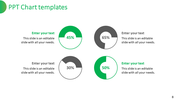
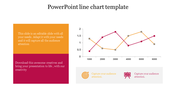
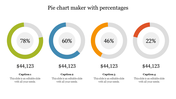
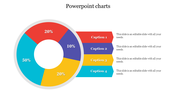
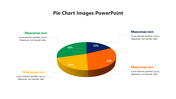
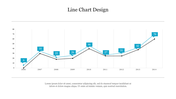
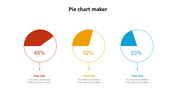
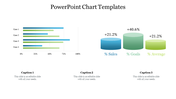
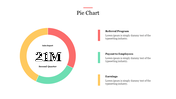
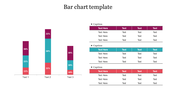
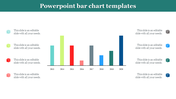
    Chart Presentation Slide


    A chart is a powerful tool for conveying complex data in a visual and easily understandable manner. Charts come in various formats, including bar charts, line graphs, pie charts, and more, allowing you to represent data points, trends, and comparisons effectively. Whether you're a business professional, educator, or student, charts are essential for presenting information clearly and facilitating data-driven decision-making. They simplify the process of digesting large datasets and help in recognizing patterns and insights. This PowerPoint chart template takes your data visualization to the next level. It's an invaluable resource for professionals, teachers, and learners alike. With an array of editable chart types, customizable options, and a selection of color schemes, this template makes it easier than ever to create compelling visual representations of your data. Users can expect to save time, enhance data clarity, and elevate their presentations. By leveraging this template, you can captivate your audience, deliver persuasive insights, and share data-driven narratives effectively, ensuring your message is both engaging and informative. Enjoy efficient chart creation and create data stories that leave a lasting impact.


    Features of the template:


    • 100% customizable slides and easy to download.
    • Slides are available in different nodes & colors.
    • The slide contains 16:9 and 4:3 formats.
    • Easy to change the colors of the slide quickly.
    • Highly compatible with PowerPoint and Google Slides.
    • Well-crafted template with an instant download facility.
    Advertisement

    You May Also Like These PowerPoint Templates

    Add to Wishlist
    Download
    AI Customize
    Comprehensive project dashboard template with progress charts, data bars, and financial performance indicators.
    Free
    Add to Wishlist
    Download
    AI Customize
    A blue themed slide featuring a multi year bar chart comparison from 2016 to 2021 with three placeholders below.
    Free
    Add to Wishlist
    Download
    AI Customize
    3D chart with five colored bars in gold, red, green, teal, and orange, on individual bases, displaying percentages above.
    Add to Wishlist
    Download
    AI Customize
    KPI Dashboard slide displaying metrics with bar charts and line graphs for key business indicators.
    Free
    Add to Wishlist
    Download
    AI Customize
    Five step process chart with titled segments in shades of purple, showing stages and supporting information.
    Add to Wishlist
    Download
    AI Customize
    Innovative KWL Chart PowerPoint Presentation Slide
    Add to Wishlist
    Download
    AI Customize
    Area chart with overlapping blue, teal, and green sections, timeline on the axis, and three labeled boxes below.
    Add to Wishlist
    Download
    AI Customize
    A PowerPoint template displaying growth with stages represented by numbered circles showing data for different stages.
    Add to Wishlist
    Download
    AI Customize
    Color coded KWL chart template with sections for What I Know, What I Want to Know, and What I Learned with placeholder text.
    Add to Wishlist
    Download
    AI Customize
    Pie chart slide showcasing six labeled segments in yellow and gray with surrounding icons, on a blue networked background.
    Add to Wishlist
    Download
    AI Customize
    Pie chart slide with four numbered pie charts in blue, maroon, orange, and red, each linked to a text box with labels.
    Add to Wishlist
    Download
    AI Customize
    A slide with a line chart slide showing data for Category 1 to 2 over several years with placeholder text.
    Add to Wishlist
    Download
    AI Customize
    Innovative Pie Chart Presentation Example Slide PPT
    Add to Wishlist
    Download
    AI Customize
    PowerPoint slide featuring four bar charts with different colors and captions, each representing different data percentages.
    Add to Wishlist
    Download
    AI Customize
    Scatter plot with differently sized bubbles in orange and purple, with a legend and product descriptions to the side.
    Add to Wishlist
    Download
    AI Customize
    Green color KWL chart presentation template with sections for What I Know, What I Want to Know, and What I Learned.