MILESTONE 🌟 5 Million+ creative minds trust SlideEgg! Grab 80% OFF

Best PowerPoint Charts Template And Google Slides Design

Slide featuring a financial report with bar charts and a table, showing website and a percentage statistic on the right.
P.ID : 33142
    541 views
    58 Downloads
    Get Custom Slides by Experts
    Instantly Access Templates in PowerPoint

    Powerful Best PPT Charts Template Presentation


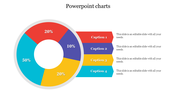
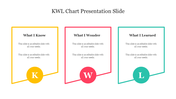
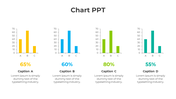
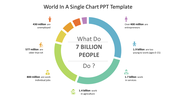
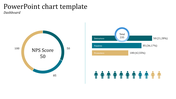
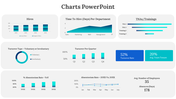
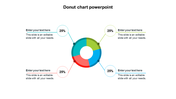
    A beautifully formatted chart with three color-coded sections - perfect for breaking down complex information, comparing results, or showing proportions.  A dedicated text area lets you explain things clearly, and a handy circular percentage value adds instant visual impact.

    Teachers, business pros, marketers, analysts - listen up! This template is for anyone who wants to leave the confusing spreadsheets and craft presentations that resonate.

    Stop wrestling with charts that make eyes glaze over! This template's a breeze to use, saving you precious time. Plus, it works with both PowerPoint and Google Slides for ultimate convenience.

    Download this best PowerPoint charts template today and leave the data visualization dread! Captivate your audience with charts that are both informative and visually engaging.

    Features of the template


    • 100% customizable slides and easy to download.
    • The slides contain 16:9 and 4:3 formats.
    • Easy to change the colors quickly.
    • It is a well-crafted template with an instant download facility.
    • It is a 100% pre-designed slide.
    • The slide holds vibrant colors.
    Advertisement

    You May Also Like These PowerPoint Templates

    Add to Wishlist
    Download
    AI Customize
    Bar graph on a slide showing data from 2016 to 2019, with a title about statistics and a caption area section.
    Add to Wishlist
    Download
    AI Customize
    Stacked Bar Chart PowerPoint Template Presentation
    Add to Wishlist
    Download
    AI Customize
    Pareto Analysis PowerPoint And Google Slides Template
    Add to Wishlist
    Download
    AI Customize
    Editable Dot Charts PowerPoint Template For Presentation
    Add to Wishlist
    Download
    AI Customize
    Slide showcasing survey data with percentage figures in colored text boxes and icons with a comparative bar chart.
    Add to Wishlist
    Download
    AI Customize
    Hexagonal web chart with blue and red lines showing financial data for six business areas at the corners.
    Free
    Add to Wishlist
    Download
    AI Customize
    Real estate KPI dashboard showing quarterly data in a green colored pie chart and bar graphs across various categories.
    Add to Wishlist
    Download
    AI Customize
    Change curve diagram mapping emotional responses over time, with stages from shock and denial along a wavy line.
    Add to Wishlist
    Download
    AI Customize
    Innovative Cockpit Charts PowerPoint Download PPT Slides
    Add to Wishlist
    Download
    AI Customize
    A line chart  slide showing data trends across seven items with two percentage indicators with icons and caption areas.
    Add to Wishlist
    Download
    AI Customize
    Color coded timeline chart slide showing tasks over 10 months, from june 2019 to february 2020, with labeled milestones.
    Add to Wishlist
    Download
    AI Customize
    Bar chart slide showing data trends from 2016 to 2021 with three categories, highlighted in red, teal, and yellow bars.
    Add to Wishlist
    Download
    AI Customize
    Pricing Strategy chart slide highlighting four key areas from price to promotion with icons in a diamond layout.
    Add to Wishlist
    Download
    AI Customize
    Circular progress bar with four colorful concentric rings and percentage labels, surrounded by text areas.
    Free
    Add to Wishlist
    Download
    AI Customize
    Color-coded Gantt chart template for project management, displaying four phases across quarters with colorful text boxes.
    Add to Wishlist
    Download
    AI Customize
    Three outlined boxes in yellow, red, and green, each with circles labeled K, W, and L, at the bottom.