Editable KPI Dashboard Template Presentation Designs

KPI dashboard slide with metrics for Visits, Visitors, Conversion rate, and Revenue per user along with views per device.
P.ID : 34122
    482 views
    64 Downloads
    Get Custom Slides by Experts
    Instantly Access Templates in PowerPoint

    Awesome KPI Template Presentation

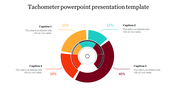
    "If you don't know where you are going, you'll end up someplace else," said Yogi Berra. Download our KPI templates, then use them to build a visual depiction of your company's goals and objectives to simplify your life. Our KPI templates make it simple to display milestones you want to attain within a specific time frame. The number of sales you want to earn, the number of followers you want on your social media accounts, or the number of leads you want your marketing team to produce might all be represented by the four nodes in this milestones graph. Our KPI PowerPoint templates and slides have a great feature where they are very elastic. Utilize this to quickly improve your marketing performance by developing a potent marketing tool.

    Features of the template

    • 100 % customizable slides and easy to download.
    • Slides are available in different nodes & colors.
    • The Slide contained 16:9 and 4:3 formats.
    • Easy to change the slide colors quickly.
    • It is a well-crafted template with an instant download facility.
    • It is designed with a stunning theme design.
    • Best template for KPI graphical Presentation.
    Advertisement

    You May Also Like These PowerPoint Templates

    Add to Wishlist
    Download
    AI Customize
    KWL chart slide with three light gray boxes, featuring maroon headers and side labels for knowledge tracking.
    Add to Wishlist
    Download
    AI Customize
    3D bar chart with four vertical bars in blue, teal, purple, and yellow, with percentage labels and captions for each.
    Add to Wishlist
    Download
    AI Customize
    Slide with three charts, each having four bars in green, pink, yellow, and blue, with text below.
    Add to Wishlist
    Download
    AI Customize
    KWL Chart Infographics PPT Template For Presentation
    Add to Wishlist
    Download
    AI Customize
    EDITABLE TRACTION POWERPOINT DESIGN TEMPLATES
    Free
    Add to Wishlist
    Download
    AI Customize
    Slide with a circular chart and two bars, highlighted in red, with progress indicator and explanatory text beside.
    Add to Wishlist
    Download
    AI Customize
    Pie chart on the left with four colored sections and percentages, alongside steps with matching colors on the right.
    Add to Wishlist
    Download
    AI Customize
    PowerPoint slide with multiple charts and graphs, including a line chart, bar chart, and area chart, each with captions.
    Add to Wishlist
    Download
    AI Customize
    PPT slide with a line chart illustrating trends for three series, using red, blue, and yellow lines with a caption.
    Add to Wishlist
    Download
    AI Customize
    Technology slide featuring a line graph with data points and percentages, set against a grayscale geometric pattern.
    Add to Wishlist
    Download
    AI Customize
    Project Gantt chart PPT slide showing project tasks, progress percentages, and timelines for November and December 2020.
    Add to Wishlist
    Download
    AI Customize
    Two brown 3D pie charts side by side, showing company growth and achievement with segmented sections.
    Add to Wishlist
    Download
    AI Customize
    Chart slide featuring a weekly schedule with multiple rows and columns with placeholder text gradient blue and green bars.
    Add to Wishlist
    Download
    AI Customize
    Editable PowerPoint Chart Templates For Presentation
    Add to Wishlist
    Download
    AI Customize
    Infographic with bar charts, percentage stats, and a layered blue 3D smartphone like structure with four captions.
    Free
    Add to Wishlist
    Download
    AI Customize
    Line chart with green and yellow lines showing three data series, text placeholders and a starburst badge.