Get Modern Speedometer PowerPoint Template and Google Slides

Orange speedometer infographic with three semicircular gauges showing percentages, each with captions below.
P.ID : 16958
    191 views
    16 Downloads
    Get Custom Slides by Experts
    Instantly Access Templates in PowerPoint

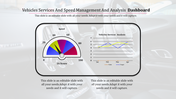
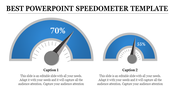
    Best Speedometer Presentation Template


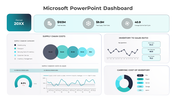
    Need to showcase progress, performance, or achievement visually? Our PowerPoint speedometer template is your solution! It features three dynamic speedometers in a vibrant yellow color scheme, this template allows you to instantly convey key metrics and data points in a way that's both clear and engaging. Each speedometer can be customized to represent different values, allowing you to showcase progress towards multiple goals or compare performance across different categories. Whether you're a business professional tracking project progress, a student presenting research findings, or an athlete showcasing performance improvements, this template is your key to crafting presentations that are both informative and visually impactful. Download it today!

    Feature of the template

    • 100% customizable slides and easy to download.
    • Slides are available in different nodes & colors.
    • The slide is contained in 16:9 and 4:3 format.
    • Easy to change the slide colors quickly.
    • Well-crafted template with an instant download facility. 
    Advertisement

    You May Also Like These PowerPoint Templates

    Add to Wishlist
    Download
    AI Customize
    PowerPoint slide with a tachometer graphic showing numbers 1 through 8 in different colors, with placeholders for captions.
    Add to Wishlist
    Download
    AI Customize
    Colorful tachometer PowerPoint slide design with transportation icons including airplane, car, bus, and train with captions.
    Add to Wishlist
    Download
    AI Customize
    Ten speedometer icons in two rows, each with blue, green, and red segments, ranging from 0 to 100.
    Add to Wishlist
    Download
    AI Customize
    Tachometer slide with four gauges in orange, red, blue, and green, each with captions below describing different readings.
    Add to Wishlist
    Download
    AI Customize
    Dashboard with bar charts, line graphs, and a gauge chart in various colors and a percentage indicator, on white background.
    Add to Wishlist
    Download
    AI Customize
    Slide displaying a profit and loss presentation with a colorful gauge in the center, indicating profit and loss levels.
    Add to Wishlist
    Download
    AI Customize
    KPI dashboard layout with a yellow header, two gauge in teal and green, bar metrics, and pie charts on a light background.
    Add to Wishlist
    Download
    AI Customize
    Seven rectangular sections with financial data on top and visual charts below, bordered in blue with organized text.
    Add to Wishlist
    Download
    AI Customize
    Customer Service PowerPoint Slide for Effective Service
    Add to Wishlist
    Download
    AI Customize
    Speedometer graphic with six sections from green to red color gradient, each with icons and text areas.
    Add to Wishlist
    Download
    AI Customize
    Semi circular meter template with green, lime, yellow, and red sections, each displaying thumbs up icons, and text.
    Free
    Add to Wishlist
    Download
    AI Customize
    Effective Speedometer PowerPoint Template Presentation
    Add to Wishlist
    Download
    AI Customize
    Executive dashboard with a portfolio summary table listing project details and a pie chart displaying a quarterly report.
    Add to Wishlist
    Download
    AI Customize
    Dashboard template showing main categories, team metrics, and performance details with various visual elements.
    Add to Wishlist
    Download
    AI Customize
    Tachometer slide featuring a dial with a needle pointing to colored segments and four caption areas.
    Add to Wishlist
    Download
    AI Customize
    Set of three speedometer gauges indicating 70%, 50%, and 55%, with placeholder text areas placed in a white backdrop.
    Add to Wishlist
    Download
    AI Customize
    Central black speedometer with four surrounding colored icons, each detailing various aspects of kilometers.
    Add to Wishlist
    Download
    AI Customize
    Four section layout showing diabetes statistics, symptoms, prevention methods, and a bar chart for illness increase trends.