Download Affordable Tachometer PPT Download Now slides

Three circular tachometer dials in blue, pink, and red, each displaying different percentage values with captions below.
P.ID : 48943
    80 views
    5 Downloads
    Get Custom Slides by Experts
    Instantly Access Templates in PowerPoint

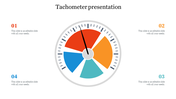
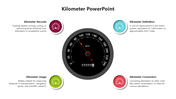
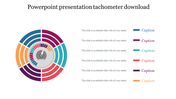
    Three Noded Tachometer Presentation Slide

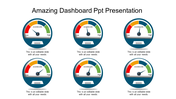
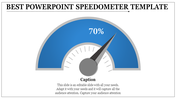
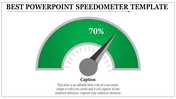
    Try our Elegant Tachometer Dashboard PPT Template to exhibit your ideas related to engines and automobiles. You can utilize the three nodes feature of this template for your presentations. This template is built with vivid tachometer clipart infographics and extensive node space. You can find the vibrant color shades of each node icon clipart, which can be changed to your taste. As this template is based on a dashboard, you can employ this template for all your automobile presentations. Grab this template for effortless work.

    Features of the template

    • 100% customizable slides and easy to download.
    • Slides are available in different nodes & colors.
    • The slide contained 16:9 and 4:3 formats.
    • Easy to change the slide colors quickly.
    • Well-crafted template with instant download facility.
    • Spacious nodes and text inserted.
    • Vibrant tricolor-themed template.
    Advertisement

    You May Also Like These PowerPoint Templates

    Add to Wishlist
    Download
    AI Customize
    Speedometer template with four gauges displaying percentages: blue at 70%, orange at 50%, dark red at 55%, and red at 85%.
    Add to Wishlist
    Download
    AI Customize
    Project dashboard with colorful bar charts, tables in red and purple, a circular gauge, and four blue phase icons below.
    Free
    Add to Wishlist
    Download
    AI Customize
     Row of colorful tachometers with different needle positions, each paired with a corresponding caption box.
    Add to Wishlist
    Download
    AI Customize
    Creative KPI Dashboard PPT And Google Slides Template
    Add to Wishlist
    Download
    AI Customize
    Executive dashboard slide displaying many charts from new business to operational expenses.
    Add to Wishlist
    Download
    AI Customize
    Dashboard template with a semi-circular gauge indicating performance with a blurred image and caption areas.
    Add to Wishlist
    Download
    AI Customize
    Dashboard slide showing plant growth data with details table and area chart for Zantedeschia, Celosia, and Calendula.
    Add to Wishlist
    Download
    AI Customize
    Colorful Tachometer slide with color coded sections from light to BMI with placeholder text.
    Add to Wishlist
    Download
    AI Customize
    Slide with three tachometer dials in blue, purple, and pink, each aligned above a matching caption box.
    Add to Wishlist
    Download
    AI Customize
    Dashboard graphics displaying vehicle speeds with a data table listing vehicles, brands, and status.
    Free
    Add to Wishlist
    Download
    AI Customize
    Four vertical pointed icons in red, blue, purple, and orange, each aligned with caption on a light background.
    Add to Wishlist
    Download
    AI Customize
    Project dashboard slides with Gantt chart, a burndown chart, and a timeline, using a palette of brown, green, and red.
    Add to Wishlist
    Download
    AI Customize
    Tachometer PowerPoint slide with gauges indicating 10, 20, and 30 with captions for each.
    Add to Wishlist
    Download
    AI Customize
    Concentric pentagons in black with text areas around each corner, forming a simple monochrome layout.
    Add to Wishlist
    Download
    AI Customize
    Horizontal infographic with four tachometer icons in gradient colors, labeled with captions for each gauge.
    Add to Wishlist
    Download
    AI Customize
    Slide featuring a tachometer dial with four performance levels and linked captions in red, yellow, maroon, and blue.
    Add to Wishlist
    Download
    AI Customize
    Slide with four red speedometers, each indicating a different percentage level, against a white background.