Free - Attractive Chart Presentation Template Slide Design
Free

 Canva
Canva
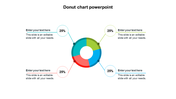

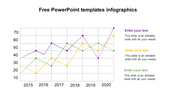
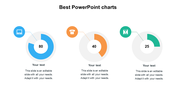


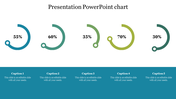
Chart Presentation Template
Seeking a template to present your business or any kind of agenda? Our Chart Presentation Template can help you with that. The slide comes with a subtle background with a graphical representation. Colorful circles are interconnected with each other within the graph. Captions and descriptions are available that can be customized.
Captions and brief descriptions are given with customization options. Perfect for analysts, business leaders, and presenters. Suitable template for showcasing financial metrics, market trends, or performance indicators. Download now to elevate your presentations effortlessly.
Features of the template
- 100% customizable slides and free to download.
- Slides are available in different nodes & colors.
- The slide contains 16:9 and 4:3 formats.
- It is easy to change the colors of the slide quickly.
- Well-crafted template with an instant download facility.


You May Also Like These PowerPoint Templates
Add to Wishlist
Download
Edit


Add to Wishlist
Download
Edit

Add to Wishlist
Download
Edit


Add to Wishlist
Download
Edit


Add to Wishlist
Download
Edit


Add to Wishlist
Download
Edit


Add to Wishlist
Download
Edit

Add to Wishlist
Download
Edit


