Innovative Chart PowerPoint And Google Slides Template

Four panel chart slide featuring a line, bar, and pie chart, each displaying data trends and comparisons.
P.ID : 5466
    341 views
    27 Downloads
    Get Custom Slides by Experts
    Instantly Access Templates in PowerPoint

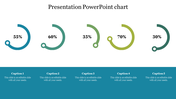
    Charts Presentation Slide


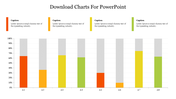
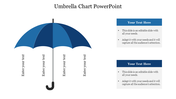
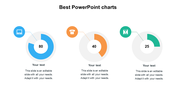
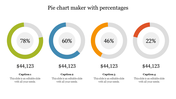
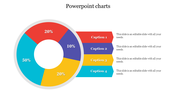
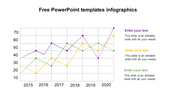
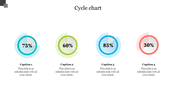
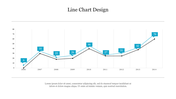
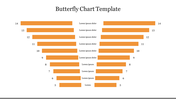
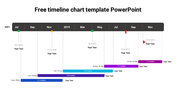
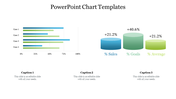
    Charts are essential visual tools for representing data, trends, and patterns in a clear and concise manner. They transform complex information into easily digestible visuals, aiding in effective communication and decision-making. Whether you're conveying financial reports, sales figures, market trends, or scientific data, charts are universally understood. They simplify data analysis and help audiences grasp key insights quickly. A well-designed chart can enhance presentations, reports, and research, making your content more engaging and persuasive. Charts come in various types, such as bar charts, line charts, pie charts, and scatter plots, each suited to specific data representations. Mastering the art of chart creation is fundamental for professionals across industries. This versatile PowerPoint template on charts caters to a wide range of users, from business professionals and educators to researchers and data analysts. The template streamlines the process of creating eye-catching charts that enhance your presentations. With fully editable slides, you can customize your charts to match your specific data and message, ensuring that your audience comprehends your information effortlessly. The template is a time-saver, allowing you to focus on content and storytelling rather than wrestling with design details. Whether you're visualizing financial data, marketing trends, or scientific research, this template empowers you to present your insights effectively and professionally. Use it to elevate your data-driven communication and empower your message to leave a lasting impact on your audience.


    Features of the template:


    • 100% customizable slides and easy to download.
    • Slides are available in different nodes & colors.
    • The slide contains 16:9 and 4:3 formats.
    • Easy to change the colors of the slide quickly.
    • Highly compatible with PowerPoint and Google Slides.
    • Well-crafted template with an instant download facility.
    Advertisement

    You May Also Like These PowerPoint Templates

    Add to Wishlist
    Download
    AI Customize
    Dashboard template showing sales, orders, visitors, and users metrics with visual bar and pie charts for website analysis.
    Add to Wishlist
    Download
    AI Customize
    Colorful progress bars in rows, showing numbered squares in red, teal, purple, and blue, with text on the right.
    Add to Wishlist
    Download
    AI Customize
    Professional setting with pie charts showing task distribution in red tones for analysis, collection, and development.
    Add to Wishlist
    Download
    AI Customize
    Dashboard chart displaying social media subscribers by gender, age, most read articles, and categories in 2019.
    Add to Wishlist
    Download
    AI Customize
    Chart showing blue bars representing growth metric alongside an orange line marking an ascending trend over eight categories.
    Free
    Add to Wishlist
    Download
    AI Customize
    Line chart in teal showing data points from 2013 to 2020 on a white background, with five icons listed on the right.
    Free
    Add to Wishlist
    Download
    AI Customize
    Histogram on the left and Pareto chart in pink and orange with cumulative line on the right.
    Free
    Add to Wishlist
    Download
    AI Customize
    Dashboard with a timeline bar chart in green and purple, labeled with milestones for savings and investments.
    Add to Wishlist
    Download
    AI Customize
    Waterfall PowerPoint chart displaying increases and decreases for eight items with color coded bars for each change.
    Add to Wishlist
    Download
    AI Customize
    Horizontal bar graph slide with four colored steps and corresponding descriptions on the right.
    Add to Wishlist
    Download
    AI Customize
    Sales performance dashboard template in red displaying revenue, recent sales, user data, and session metrics visually.
    Add to Wishlist
    Download
    AI Customize
    Dashboard showing from defect rate trends upto delivery time analysis in mixed orange and brown theme.
    Add to Wishlist
    Download
    AI Customize
    KPI slide with four semi circular gauges displaying metrics and overlapping colored circles showing numerical data.
    Add to Wishlist
    Download
    AI Customize
    KPI dashboard layout with bar charts, a gauge, captions, and target metrics on light gray background, organized in sections.
    Add to Wishlist
    Download
    AI Customize
    Slide with two donut charts displaying values and a text section on the right with a blurred background image.
    Add to Wishlist
    Download
    AI Customize
    Stacked column chart template displaying proportional data distribution across four categories using three series.
    Add to Wishlist
    Download
    AI Customize
    Colorful circular diagram slide illustrating four corporate strategy methods with labels and percentages.
    Add to Wishlist
    Download
    AI Customize
    KWL chart with sections  in blue, green, and red, each column containing placeholder text.