Numerous Chart PowerPoint Presentation and Google Slides

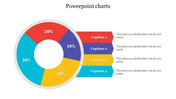
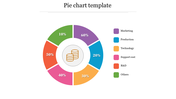
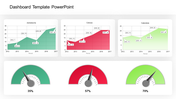
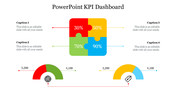
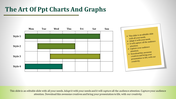

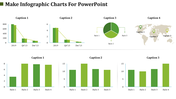

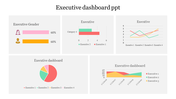
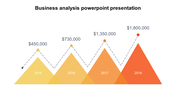
Chart PowerPoint Presentation and Google Slides
Our Chart PowerPoint Presentation and Google Slides template is a versatile tool designed for individuals across various industries seeking to enhance their data-driven presentations. This template is especially valuable for analysts, researchers, educators, and business professionals aiming to communicate statistical information and global trends effectively.
The template features three medium-sized bar charts, a pie chart, and a graph, providing a comprehensive visual representation of data. Additionally, a world map is incorporated, allowing for a global perspective. Whether you are presenting financial figures, market trends, or research findings, this template serves as a visual aid to convey complex information concisely.
The purpose of this template is to empower users to create impactful presentations that involve data analysis, market insights, or global trends. It caters to a broad audience, including professionals in finance, marketing, education, and research.
Enhance your presentations with our Chart PowerPoint template and Google Slides. Simplify complex data, captivate your audience, and effectively convey your message, regardless of your field or industry.
Features of the template
- 100% customizable slides and easy to download.
- Slides are available in different nodes & colors.
- The slide contains 16:9 and 4:3 formats.
- It is easy to change the colors of the slide quickly.
- Well-crafted template with an instant download facility.


You May Also Like These PowerPoint Templates
Free
Add to Wishlist
Download
AI Customize


Add to Wishlist
Download
AI Customize

Add to Wishlist
Download
AI Customize

Add to Wishlist
Download
AI Customize

Add to Wishlist
Download
AI Customize

Add to Wishlist
Download
AI Customize


Add to Wishlist
Download
AI Customize


Add to Wishlist
Download
AI Customize


Free
Add to Wishlist
Download
AI Customize

Free
Add to Wishlist
Download
AI Customize


Add to Wishlist
Download
AI Customize

Add to Wishlist
Download
AI Customize

Add to Wishlist
Download
AI Customize
