Effective Dashboard Slide Template PPT Presentation

Colorful dashboard PPT slide with world map, pie charts, bar graphs, and metrics with placeholder text.
P.ID : 51472
    508 views
    63 Downloads
    Get Custom Slides by Experts
    Instantly Access Templates in PowerPoint

    Multispecialty Dashboard Slide With Maps

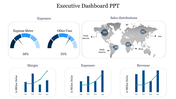
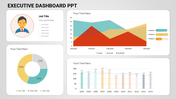
    Now you can analyze all your data on a single screen. Yes, it is possible with the help of dashboard slides. The dashboard is an information management tool where you can calculate, analyze and view the key performance indicators. You can directly show the metrics and data points. This slide is a fusion one that has a world map, bar diagrams, pie charts, etc. Using all these, you can make perfect data analysis, and also you can pinpoint the places on maps. It will take less time to prepare a presentation with this pre-designed slide. You can add your texts more comfortably in the place given. Download the dashboard slide to create a perfect business information presentation for meetings. Download Now!!

    Features of the template

    • 100% customizable slides and easy to download.
    • Slides are available in different nodes & colors.
    • The slide contains 16:9 and 4:3 formats.
    • Easy to change the colors of the slide quickly.
    • Well-crafted template with instant download facility.
    • Perfect dashboard with maps.
    Advertisement

    You May Also Like These PowerPoint Templates

    Free
    Add to Wishlist
    Download
    AI Customize
    Pie chart in orange, red, green, and blue sections with two text labels on either side, highlighting sales performance.
    Add to Wishlist
    Download
    AI Customize
    Dashboard gauge chart PPT template with color coded sections for big loss, loss, break even, profit, and high profit.
    Add to Wishlist
    Download
    AI Customize
    Infographic charts for PowerPoint slide featuring bar, pie, and map charts in different styles and colors.
    Free
    Add to Wishlist
    Download
    AI Customize
    Red-themed circular gauge divided into five sections from direction to business, with a central needle indicator.
    Add to Wishlist
    Download
    AI Customize
    Executive dashboard slide with gender bar chart, line graph,pie chart, and area chart for executive data analysis.
    Free
    Add to Wishlist
    Download
    AI Customize
    Six-layer bullseye diagram executive dashboard with annotations on each layer, arranged symmetrically around the circle.
    Add to Wishlist
    Download
    AI Customize
    Attractive Project Management Dashboard Slide Template
    Free
    Add to Wishlist
    Download
    AI Customize
    Green radial gauge with a modern layout, surrounded by five labeled rectangular sections on a neutral background.
    Free
    Add to Wishlist
    Download
    AI Customize
    PowerPoint slide with a project dashboard showing two speedometers to represent project progress with captions.
    Add to Wishlist
    Download
    AI Customize
    Slide with multiple charts including bar, line, and pie charts illustrating data for hires, turnover, and training.
    Add to Wishlist
    Download
    AI Customize
    Orange speedometer slide with a gauge showing 70% progress and space for caption text below.
    Free
    Add to Wishlist
    Download
    AI Customize
    Tachometer PowerPoint slide featuring a colorful gauge with segments labeled with space for captions on a white backdrop.
    Add to Wishlist
    Download
    AI Customize
    Executive dashboard with a pie chart, vertical and horizontal bar graph, and a waterfall chart, displaying various data.
    Add to Wishlist
    Download
    AI Customize
    Executive dashboard slide displaying colorful charts for executing dashboard to quality.
    Add to Wishlist
    Download
    AI Customize
    Business dashboard featuring a profile card, three financial metrics, a 67% circular chart, and a dual-colored area graph.
    Add to Wishlist
    Download
    AI Customize
    Dashboard summary featuring progress visualizations, names, task status updates, and rewards marked with gold stars.
    Add to Wishlist
    Download
    AI Customize
    A colorful dashboard PowerPoint slide featuring graphs, stats, and a pie chart for a data driven presentation with captions.
    Add to Wishlist
    Download
    AI Customize
    Dashboard PowerPoint slide featuring three speedometer style gauges displaying percentages with a dartboard graphic.
    Free
    Add to Wishlist
    Download
    AI Customize
    Dashboard slide with a world map highlighting countries, a bar chart showing statistics, and two percentage indicators.