Executive Dashboard PowerPoint Template and Google Slides

Dashboard summary featuring progress visualizations, names, task status updates, and rewards marked with gold stars.
P.ID : 18897
    944 views
    74 Downloads
    Get Custom Slides by Experts
    Instantly Access Templates in PowerPoint

    Master Decision-Making: Executive Dashboard PPT Template


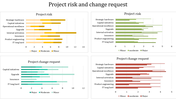
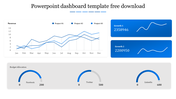
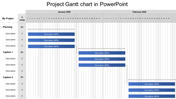
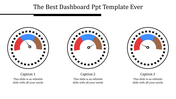
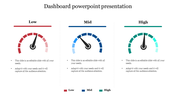
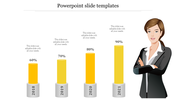
    Effortlessly steer your organization towards success with our Executive Dashboard PowerPoint Template and Google Slides Themes. Crafted to perfection, this template features a dynamic table adorned with percentage levels, intuitive icons, rating stars, detailed descriptions, and insightful summaries. Best for executives, managers, and decision-makers, our template empowers users to monitor key performance indicators, track progress, and make data-driven decisions with confidence. Whether presenting financial metrics, project status updates, or market trends, our Executive Dashboard provides a comprehensive overview in a visually engaging format. Elevate your presentations and streamline decision-making processes with this versatile template. With its professional design and user-friendly interface, our Executive Dashboard ensures impactful communication and strategic alignment across your organization. Unlock new levels of efficiency and effectiveness.

    Features of the template


    • 100% customizable slides are easy to download.
    • Slides are available in different colors.
    • The slide has 4:3 and 16:9 formats.
    • It is easy to change the slide colors quickly.
    • It has a cute design to impress an audience.
    • Create feature-rich, animated presentations.
    • This slide is available in both PowerPoint and Google Slides.
    Advertisement

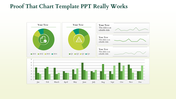
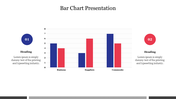
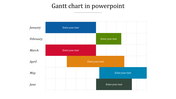
    You May Also Like These PowerPoint Templates

    Add to Wishlist
    Download
    AI Customize
    Slide with a vertical bar chart and four labeled sections, each paired with a unique color and icon.
    Free
    Add to Wishlist
    Download
    AI Customize
    Market research slide showing a line graph with three levels over the years 2016 and 2019, with a caption box.
    Free
    Add to Wishlist
    Download
    AI Customize
    A blue themed slide featuring a multi year bar chart comparison from 2016 to 2021 with three placeholders below.
    Free
    Add to Wishlist
    Download
    AI Customize
    3D chart with five colored bars in gold, red, green, teal, and orange, on individual bases, displaying percentages above.
    Add to Wishlist
    Download
    AI Customize
    Innovative KWL Chart PowerPoint Presentation Slide
    Add to Wishlist
    Download
    AI Customize
    Analysis report template featuring a purple and green area graph comparing five projects, with separate information
    Add to Wishlist
    Download
    AI Customize
    Area chart with overlapping blue, teal, and green sections, timeline on the axis, and three labeled boxes below.
    Add to Wishlist
    Download
    AI Customize
    A PowerPoint template displaying growth with stages represented by numbered circles showing data for different stages.
    Add to Wishlist
    Download
    AI Customize
    Color coded KWL chart template with sections for What I Know, What I Want to Know, and What I Learned with placeholder text.
    Add to Wishlist
    Download
    AI Customize
    Pie chart slide showcasing six labeled segments in yellow and gray with surrounding icons, on a blue networked background.
    Add to Wishlist
    Download
    AI Customize
    Pie chart slide with four numbered pie charts in blue, maroon, orange, and red, each linked to a text box with labels.
    Add to Wishlist
    Download
    AI Customize
    A slide with a line chart slide showing data for Category 1 to 2 over several years with placeholder text.
    Add to Wishlist
    Download
    AI Customize
    Innovative Pie Chart Presentation Example Slide PPT
    Add to Wishlist
    Download
    AI Customize
    Timeline chart template showing tasks across four years with segmented bars in yellow, red, and purple.
    Add to Wishlist
    Download
    AI Customize
    PowerPoint slide featuring four bar charts with different colors and captions, each representing different data percentages.
    Add to Wishlist
    Download
    AI Customize
    Scatter plot with differently sized bubbles in orange and purple, with a legend and product descriptions to the side.
    Add to Wishlist
    Download
    AI Customize
    Green color KWL chart presentation template with sections for What I Know, What I Want to Know, and What I Learned.
    Add to Wishlist
    Download
    AI Customize
    Yearly loss chart with six green bars and a line graph illustrating trends from 2014 to 2019.