Slidea Logo
Try it now — the new, easy way to turn your slides into an interactive experience.
Explore Now

The Market Research PowerPoint And Canva Template

Pack of 18 slides
P.ID : 15924
Advertisement
1.2K+ views
276 Downloads
Get Custom Slides by Experts
Enhance Your Presentations with Add-ins
Google Slides Add-in
Access templates directly in Google Slides
Microsoft PowerPoint Add-in
Access templates directly in PowerPoint
GPT Add-on
AI-powered presentation assistance

Market Research PowerPoint, Google Slides, and Canva Template


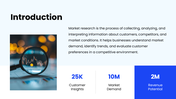
  • Understanding your market is the first step toward smart business decisions, and this Market Research PowerPoint presentation template helps you present those insights clearly and professionally. It is an excellent choice for marketing professionals, business strategists, consultants, entrepreneurs, and students who need to explain market trends, customer behavior, and competitive analysis in a simple and structured presentation.

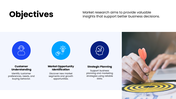
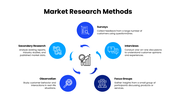
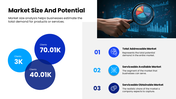
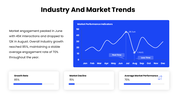
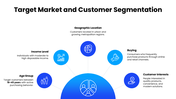
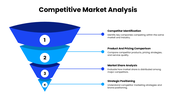
  • This template features a clean and professional blue color theme that represents trust, clarity, and data intelligence. The slides are thoughtfully designed to guide your audience through key topics such as market research introduction, research objectives, research methods, market size and potential, industry trends, target market segmentation, competitive analysis, and market opportunities. Each slide layout follows a logical flow, helping presenters explain research insights and business strategies more effectively.

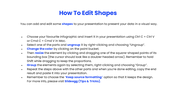
    All shapes, charts, icons, and visual elements are fully editable, allowing you to customize the presentation according to your industry, company report, or academic research project. You can easily update charts, change colors, modify text, and rearrange layouts without needing advanced design experience.

    Whether you are presenting a marketing strategy, business analysis report, startup research findings, or an academic project, this template helps you transform complex market data into clear and impactful visual communication.

    Present your research insights with clarity and confidence. Download the Market Research PowerPoint template today and create a professional presentation that highlights market opportunities, customer insights, and strategic growth ideas.


    Features of this template

    • 100% customizable slides and easy to download.
    • The slides contain 16:9 and 4:3 formats.
    • Easy to change the colors quickly.
    • Highly compatible with PowerPoint, Google Slides, and Canva templates.

    You May Also Like These PowerPoint Templates

    Add to Wishlist
    Download
    AI Customize
    Company annual report template featuring a line chart with two data series and space for points and descriptions with text.
    Add to Wishlist
    Download
    AI Customize
    Cycle chart slide featuring four percentage indicators in teal, green, blue, and red, with captions beow.
    Free
    Add to Wishlist
    Download
    AI Customize
    Timeline slide with horizontal bars in shades of green and blue, aligned to weekdays with placeholder text.
    Free
    Add to Wishlist
    Download
    AI Customize
    KWL chart PowerPoint template with sections for What I Know, What I Want to Know, and What I Learned with placeholder text.
    Add to Wishlist
    Download
    AI Customize
    Five vibrant 3D blocks in purple, green, orange, blue, and yellow, with captions for each section.
    Add to Wishlist
    Download
    AI Customize
    Gantt chart in blue tones, showing task progress over weeks with horizontal bars and assigned team members.
    Free
    Add to Wishlist
    Download
    AI Customize
    A PPT chart template featuring a table layout with rows labeled Text and columns with bar charts in different shades of blue.
    Add to Wishlist
    Download
    AI Customize
    A donut chart with four sections in green, red, and white, labeled with percentages, and text boxes around it.
    Free
    Add to Wishlist
    Download
    AI Customize
    PPT slide with a blue bar chart showing percentages for the years 2016 to 2021 with a woman standing next to the chart.
    Add to Wishlist
    Download
    AI Customize
    Business column chart template showing four bar sections, each representing industries with icons and data percentages.
    Add to Wishlist
    Download
    AI Customize
    Colorful bar chart slide for an annual report in PowerPoint, displaying monthly data from January to December.
    Add to Wishlist
    Download
    AI Customize
    Gantt chart with a task breakdown, progress percentages, and a status table for project planning and execution.
    Free
    Add to Wishlist
    Download
    AI Customize
    Five-step timeline with icons for connectivity, achievement, computers, pie chart, and security, paired with text.
    Free
    Add to Wishlist
    Download
    AI Customize
    Line chart with data points marked by blue squares and black dots, displaying values from 2006 to 2014.
    Add to Wishlist
    Download
    AI Customize
    Bar chart with colorful columns of varying heights representing percentages, with social media icons below.
    Add to Wishlist
    Download
    AI Customize
    Gantt chart with colorful horizontal bars spanning from January to June, representing project timelines and milestones.
    Free
    Add to Wishlist
    Download
    AI Customize
    Slide with line and trends charts, showing five columns of data with placeholder text for each chart segment.
    Add to Wishlist
    Download
    AI Customize
    3D cone charts in blue shades with percentage labels, showing two datasets with a legend on the right.
    Add to Wishlist
    Download
    AI Customize
    Gantt chart template illustrating project phases, milestones, and a timeline structure from January to December.
    Add to Wishlist
    Download
    AI Customize
    Matrix chart with skill and will axes, divided into quadrants labeled high and low, with numbered circles and icons.
    Add to Wishlist
    Download
    AI Customize
    PowerPoint chart template displaying three donut charts with percentages and icons representing data categories.
    Add to Wishlist
    Download
    AI Customize
    Project plan Gantt chart template displaying tasks with milestones and progress percentages across months from Jan to Dec.
    Add to Wishlist
    Download
    AI Customize
    Bar chart presentation showing data from 2017 to 2020, with values 2.4, 4.4, 1.8, and 2.8, respectively.
    Free
    Add to Wishlist
    Download
    AI Customize
    Horizontal timeline graphic with five purple arrows, labeled captions and date ranges, aligned with a month indicator.
    Add to Wishlist
    Download
    AI Customize
     Project timeline chart with horizontal bars indicating tasks with milestone markers placed in white background.
    Add to Wishlist
    Download
    AI Customize
    3D pie chart with four color-coded segments red, orange, yellow, and brown displaying percentage values.
    Add to Wishlist
    Download
    AI Customize
    PPT template for an annual report featuring a bar graph comparing data across three time periods with color coded categories.
    Free
    Add to Wishlist
    Download
    AI Customize
    Bar chart slide with three stacked bars, each divided into segments with percentage labels, and a table on the right.
    Add to Wishlist
    Download
    AI Customize
    Gantt chart layout with five vertical milestone markers in blue, black, brown, green, and yellow.
    Add to Wishlist
    Download
    AI Customize
    Timeline charts slides showcasing different stages and tasks across various projects, with color coded bars for each task.
    Free
    Add to Wishlist
    Download
    AI Customize
    Slide with four green donut charts and two horizontal bar graphs showing data comparisons across quarters and months.
    Free
    Add to Wishlist
    Download
    AI Customize
    Illustration of six red bars with corresponding percentages and a businesswoman standing beside them.
    Add to Wishlist
    Download
    AI Customize
    Company annual report slide with a gray and red graph displaying data with percentage values for investment and profit.