Best Market Research PPT and Google Slides Template


 Canva
Canva
Market Research PowerPoint, Google Slides, and Canva Template
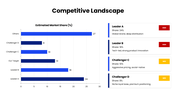
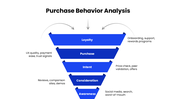
Turn your data into clear insights with this Market Research PowerPoint Template! Designed for marketers, analysts, students, and business professionals, this clean blue-themed template helps you present research findings in a simple, engaging, and professional way. With fully editable slides and smart layouts, you can easily showcase market size, trends, customer behavior, and competitive analysis without any confusion.
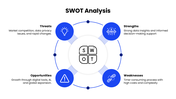
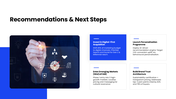
Perfect for business reports, strategy meetings, or academic presentations, this template includes well-structured slides like executive summary, research objectives, methodology, SWOT analysis, and conclusions. The modern blue design builds trust and clarity, while the editable shapes, charts, and visuals make your data easy to understand and visually appealing.
Present your research with confidence and clarity! Download this market research PPT template today and create impactful, professional slides in minutes.
Features of this template
- 100% customizable slides and easy to download.
- The slides contain 16:9 and 4:3 formats.
- Easy to change the colors quickly.
- Highly compatible with PowerPoint, Google Slides, and Canva templates.


You May Also Like These PowerPoint Templates


