Quantitative Market Research PowerPoint And Google Slides

 Canva
Canva
Quantitative Market Research PowerPoint, Google Slides, and Canva Template
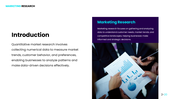
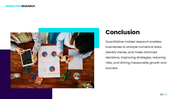
If you want to explain data clearly and make smart business decisions, this Quantitative Market Research PowerPoint template is the perfect choice. It helps you present numbers, trends, and insights in a simple and engaging way. From surveys and sampling methods to statistical analysis and data interpretation, every concept is designed to be easy to understand—even for beginners.
This template comes with a modern multicolor theme and fully editable shapes, making it flexible for any presentation need. You can quickly customize charts, graphs, icons, and layouts to match your brand or topic. Whether you are explaining research findings, showcasing data-driven strategies, or presenting reports, this template keeps your content clean, clear, and professional.
It is ideal for marketing teams, business analysts, students, educators, and consultants. Use it for market research presentations, business reports, academic projects, or client meetings. With structured slides and visual storytelling, you can confidently communicate complex data and turn insights into action.
Start creating powerful presentations today with this Quantitative Market Research PPT template. Save time, improve clarity, and deliver impactful data stories that your audience will remember.
Features of this template
- 100% customizable slides and easy to download.
- The slides contain 16:9 and 4:3 formats.
- Easy to change the colors quickly.
- Highly compatible with PowerPoint, Google Slides, and Canva templates.


You May Also Like These PowerPoint Templates


