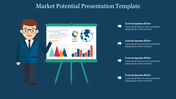
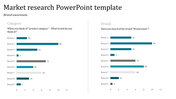
Ready To Use Research Data Presentation Templates Design


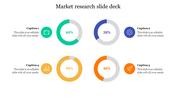

Colorful Centric Circle Inserted Template:
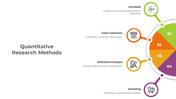
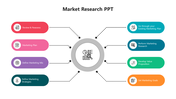
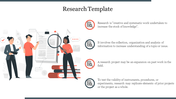
You can find these Research Data Presentation Templates more attractive with the colorful diagram presented inside them. The diagram represents your research data through the centric circles inside them with different colors denoting your research. There are three nodes inserted around the diagram, which can explain your product in a detailed manner.
There is also a caption space provided for you to enter a caption, and below them, you can enter your detailed description of your analysis. These Research Data Presentation Templates captivate your audience and concentrate them throughout your presentation. Also, you can find that its nodes are inserted with an icon beside them, which relates to your theme and makes your facts reach the audience at ease.
Features Of This Template:
- 100% customizable slides and easy to download
- Slides are available in different nodes & colors.
- The slides contained 16:9 and 4:3 format.
- Easy to change the slide colors quickly.
- Well-crafted Template with instant download facility.
- Crisp and elegant font style.
- The best Template with attractive nodes


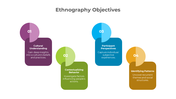
You May Also Like These PowerPoint Templates
Add to Wishlist
Download
AI Customize

Add to Wishlist
Download
AI Customize

Add to Wishlist
Download
AI Customize

Add to Wishlist
Download
AI Customize

Add to Wishlist
Download
AI Customize

Add to Wishlist
Download
AI Customize

Add to Wishlist
Download
AI Customize

Add to Wishlist
Download
AI Customize

Add to Wishlist
Download
AI Customize

Add to Wishlist
Download
AI Customize

Add to Wishlist
Download
AI Customize

Add to Wishlist
Download
AI Customize

Add to Wishlist
Download
AI Customize

Add to Wishlist
Download
AI Customize

Add to Wishlist
Download
AI Customize

Add to Wishlist
Download
AI Customize

Add to Wishlist
Download
AI Customize


Add to Wishlist
Download
AI Customize

Add to Wishlist
Download
AI Customize
