Market Research Slide Deck PowerPoint and Google Slides

Slide with four donut charts in green, blue, orange, and yellow, each filled by icons and captions area.
P.ID : 46330
    16 slides
    Slide pack with diagram featuring colored icons and various layouts, representing steps in market research analysis.
    13 slides
     Slide deck on market research templates, showing pie charts, flow diagrams, and circular graph in various colors.
    11 slides
    Five-part circular infographic slide deck displaying the steps of quantitative research methods, with colorful segments and icons.
    16 slides
    Six step research slide deck featuring circular, colorful numbered icons, with sections detailing each stage.
    755 views
    101 Downloads
    Get Custom Slides by Experts
    Instantly Access Templates in PowerPoint

    Best Market Research Presentation Slide


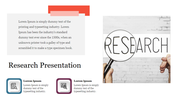
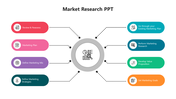
    Download this Best Market Research Slide Deck PowerPoint Template to design an outstanding presentation. It is well-designed with all the elements you need to make a professional-looking presentation. So, it will be easy even for the non-technical users to make an excellent presentation in a matter of minutes. 

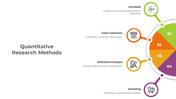
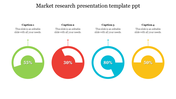
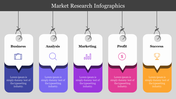
    The Best Market Research Slide Deck PowerPoint Template has a creative dashboard with multi-colors and different values. It also has colorful circles with business icons to make your market research presentation more effective. Using this template, you communicate your market research findings more clearly with your audience.  According to your requirements, you can also customize this slide.

    Features of this slide:

    1. 100% customizable slides and easy to download.
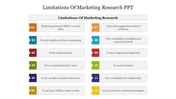
    2. Slides available in different nodes & colors.
    3. The slide contained 16:9 and 4:3 format.
    4. Easy to change the slide colors quickly.
    5. Well-crafted template with instant download facility.
    6. An excellent market research template.
    Advertisement

    You May Also Like These PowerPoint Templates

    Add to Wishlist
    Download
    AI Customize
    Slide with four donut charts in green, blue, orange, and yellow, each filled by icons and captions area.
    Add to Wishlist
    Download
    AI Customize
    Market research slide featuring two side-by-side bar charts illustrating brand awareness metrics across multiple brands.
    Add to Wishlist
    Download
    AI Customize
    Ethnography objectives slides with four colorful sections and different layout designs with icons and text descriptions.
    Add to Wishlist
    Download
    AI Customize
    Horizontal bars in green, yellow, blue, and purple, paired with icons, indicating progress percentages in a clean layout.
    Add to Wishlist
    Download
    AI Customize
    Illustration of three people conducting research with a magnifying glass and clipboard, and four texts with icons.
    Add to Wishlist
    Download
    AI Customize
    Research template featuring a magnifying glass and four colored sections with placeholder text areas.
    Add to Wishlist
    Download
    AI Customize
    Four colored caption boxes linked to green, yellow, blue, and red circular icons, forming part of a segmented circular chart.
    Add to Wishlist
    Download
    AI Customize
    Infographic with diamond icons in green and blue, illustrating key market analysis processes and their descriptions.
    Free
    Add to Wishlist
    Download
    AI Customize
    Market research slide showing a line graph with three levels over the years 2016 and 2019, with a caption box.
    Add to Wishlist
    Download
    AI Customize
    Market research plan slide with a triangular diagram, financial icons, and percentage based data visualization with captions.
    Add to Wishlist
    Download
    AI Customize
    Market research infographic PPT slide showing a 70-30 percent comparison with user icons and financial symbol with a caption.
    Add to Wishlist
    Download
    AI Customize
    World map with six orange location markers and a left-side orange panel containing placeholder text.
    Add to Wishlist
    Download
    AI Customize
    Ready To Use Research Data Presentation Templates Design
    Add to Wishlist
    Download
    AI Customize
    Best Market Research PPT and Google Slides Template
    Add to Wishlist
    Download
    AI Customize
    Vertical bar graph with six multi-colored bars showing percentages from 30% to 100%, with icons representing categories.