Slidea Logo
Try it now — the new, easy way to turn your slides into an interactive experience.
Explore Now

Quantitative Market Research Techniques PowerPoint

Pack of 18 slides
P.ID : 77322
Advertisement
1 views
1 Downloads
Get Custom Slides by Experts
Enhance Your Presentations with Add-ins
Google Slides Add-in
Access templates directly in Google Slides
Microsoft PowerPoint Add-in
Access templates directly in PowerPoint
GPT Add-on
AI-powered presentation assistance

Quantitative Market Research Techniques PowerPoint, Google Slides, and Canva Template


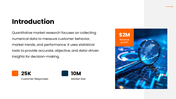
Turn numbers into clear insights with this Quantitative Market Research Techniques PowerPoint template. Designed to simplify data-driven storytelling, this template helps you present statistics, trends, surveys, and analytical results in a way that is easy to understand and visually engaging. It is perfect for explaining complex numerical data without overwhelming your audience.

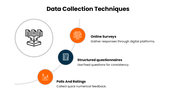
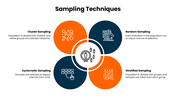
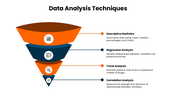
This template is ideal for market researchers, data analysts, business professionals, students, and educators who work with quantitative data. Whether you are presenting survey results, sampling methods, or data analysis techniques, the clean blue-themed design keeps your slides professional, structured, and impactful.


Every slide is built with fully editable shapes, charts, and infographics, allowing you to customize your data, visuals, and content quickly. You can easily update graphs, icons, and layouts to match your research findings or business goals—no advanced design skills needed.


Make your data speak with clarity and confidence. Download the Quantitative Market Research Techniques template today and create impactful, insight-driven presentations that stand out.


Features of this template

  • 100% customizable slides and easy to download.
  • The slides contain 16:9 and 4:3 formats.
  • Easy to change the colors quickly.
  • Highly compatible with PowerPoint, Google Slides, and Canva templates.

You May Also Like These PowerPoint Templates

Add to Wishlist
Download
AI Customize
Research presentation slide with a magnifying glass focusing on the word and a text block with two icons.
Free
Add to Wishlist
Download
AI Customize
Slide featuring research methodology with four methods accompanied by illustrations of people analyzing data with text area.
Add to Wishlist
Download
AI Customize
Market analysis PPT slide with five circular progress bars, each displaying a percentage and accompanied by placeholder text.
Add to Wishlist
Download
AI Customize
 Slide deck on market research templates, showing pie charts, flow diagrams, and circular graph in various colors.
Add to Wishlist
Download
AI Customize
Vertical bar graph with six multi-colored bars showing percentages from 30% to 100%, with icons representing categories.
Add to Wishlist
Download
AI Customize
Add to Wishlist
Download
AI Customize
Research slide with four blue and gray semi-circular percentage completion rings and product images, each with text areas.
Add to Wishlist
Download
AI Customize
An upward-branching diagram from a house icon with four sections representing different steps, each marked by a icon.
Add to Wishlist
Download
AI Customize
Market research slide featuring two side-by-side bar charts illustrating brand awareness metrics across multiple brands.
Add to Wishlist
Download
AI Customize
2021 calendar template showing monthly grids for all 12 months with labeled weekdays and color-coded sections for each month.
Add to Wishlist
Download
AI Customize
Market research slides include topics like primary research, secondary research, and qualitative and quantitative approaches.
Add to Wishlist
Download
AI Customize
Market research dashboard with a segmented horizontal bar chart analyzing brand perception and a donut chart.
Add to Wishlist
Download
AI Customize
Slide showing six colorful boxes in brown, blue, red, green, purple, yellow, and gray, with icons for research techniques.
Add to Wishlist
Download
AI Customize
Market research plan slide with a triangular diagram, financial icons, and percentage based data visualization with captions.
Add to Wishlist
Download
AI Customize
Add to Wishlist
Download
AI Customize
Market research infographic PPT slide showing a 70-30 percent comparison with user icons and financial symbol with a caption.
Add to Wishlist
Download
AI Customize
Four-step diagram showing icons for market research elements, each with a percentage progress bar and placeholder text.
Add to Wishlist
Download
AI Customize
Slide pack featuring PICO question framework with multiple layouts, using yellow, red, blue, and gray color schemes.