Best PowerPoint Speedometer Template for Business Analysis

Speedometer diagram displaying three different percentages from 70% to 60% with placeholder text areas.
P.ID : 16957
    209 views
    20 Downloads
    Get Custom Slides by Experts
    Instantly Access Templates in PowerPoint

    Speedometer Graphic Presentation Template


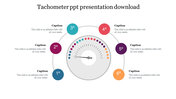
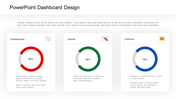
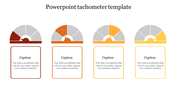
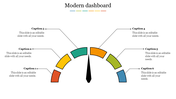
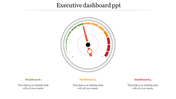
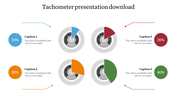
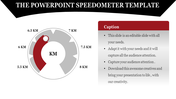
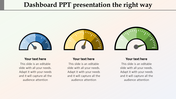
    Get ready to rev up your presentations with our Speedometer PowerPoint Template and Google Slides. This dashboard presentation template is all about motion and progress, featuring a big speedometer front and centre, flanked by two smaller gauges for extra visual flair. You can tweak everything to suit your needs – change the colors, move the needles, and add your text to match your data or story. It labels each section of the speedometer to indicate what each range represents. This helps your audience understand the data at a glance.

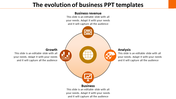
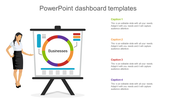
    Whether you're a business whiz tracking KPIs, a project manager showcasing milestones, or a teacher highlighting progress, this template has you covered. Ready to take your skills to the next grade? Grab the Template today and see the difference! And don't forget to check out our other awesome templates for even more options!

    Features of the template:

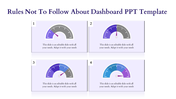
    • Slides are available in different nodes & colors.
    • Easy to change the slide colors.
    • Well-crafted template with instant download.
    Advertisement

    You May Also Like These PowerPoint Templates

    Add to Wishlist
    Download
    AI Customize
    Slide design featuring three green speedometer graphics displaying different progress levels, each paired with a caption.
    Add to Wishlist
    Download
    AI Customize
    Project dashboard slide with a compass design,  featuring four labeled captions, and an orange sidebar for text.
    Add to Wishlist
    Download
    AI Customize
    Dashboard slide featuring six sections with graphs and metrics for annual performance in blue and green.
    Add to Wishlist
    Download
    AI Customize
    Effective Dashboard PowerPoint Templates Design
    Add to Wishlist
    Download
    AI Customize
    Dashboard slide featuring a stacked bar chart in red, green, and purple, and two speedometer gauge indicators below.
    Add to Wishlist
    Download
    AI Customize
    Dashboard slide with a circular chart in blue shades, featuring percentage labels, and five icons with text on the right.
    Add to Wishlist
    Download
    AI Customize
    Dashboard slide with a pie chart, stacked area chart, and multiple colored rectangular boxes displaying metrics.
    Add to Wishlist
    Download
    AI Customize
    KPI dashboard slide with metrics for Visits, Visitors, Conversion rate, and Revenue per user along with views per device.
    Add to Wishlist
    Download
    AI Customize
    Best Dashboard Sales Performance Reports Revenue Charts
    Add to Wishlist
    Download
    AI Customize
    Dashboard with bar chart comparing planned vs. actual tasks for projects, pie chart for project share, and a line graph displaying project data.
    Add to Wishlist
    Download
    AI Customize
    Green themed chart layout featuring bar graphs, pie charts, line graphs, and a world map for diverse data visualization.
    Add to Wishlist
    Download
    AI Customize
    Gray slide layout with a semicircular gauge in gradient colors of red, orange, and green, and a sidebar with text.
    Add to Wishlist
    Download
    AI Customize
    Dashboard layout with charts, graphs, and a world map in vibrant colors, showcasing data visually.
    Add to Wishlist
    Download
    AI Customize
    Circular gauge template with sections in red, orange, yellow, green, and dark green, with captions on either side.
    Add to Wishlist
    Download
    AI Customize
    Infographic dashboard featuring a world map with COVID-19 case data, a gender-based death rate chart, and a pie chart.
    Add to Wishlist
    Download
    AI Customize
    PowerPoint slide for executive dashboard featuring four icons target, speed, error reduction, and growth with text area.
    Add to Wishlist
    Download
    AI Customize
    KPI dashboard template PowerPoint slide featuring three sections for data visualization.