Download KPI Presentation Template and Google Slides

Marketing KPI template with three circular icons, and bar and line charts in blue, gray, and green below.
P.ID : 34111
    381 views
    29 Downloads
    Get Custom Slides by Experts
    Instantly Access Templates in PowerPoint

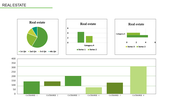
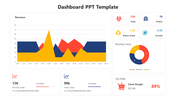
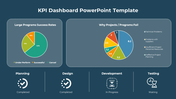
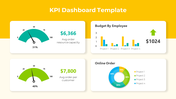
    Measure Success: KPI Powerpoint Template


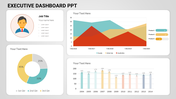
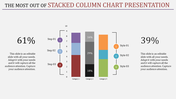
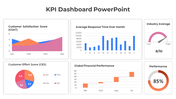
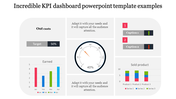
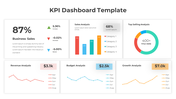
    Key Performance Indicators (KPIs) are measurable values that demonstrate how effectively an organization is achieving its key business objectives. Empower your presentations with our KPI Presentation Template & Google Slides Themes. It has three chart designs, each accompanied by an icon, caption, and text area. This template is essential for professionals seeking to visualize and communicate key performance indicators effectively. Ideal for managers, analysts, and executives, it enables you to showcase performance metrics, trends, and goals with clarity and impact. Whether presenting quarterly reports, tracking project milestones, or monitoring sales performance, this template equips you with the tools to measure success and drive strategic decision-making.

    Features of the template


    • 100% customizable slides are easy to download.
    • Slides are available in different colors.
    • The slide has 4:3 and 16:9 formats.
    • It is easy to change the slide colors quickly.
    • It has a cute design to impress an audience.
    • Create feature-rich, animated presentations.
    Advertisement

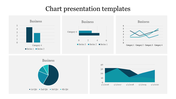
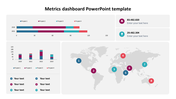
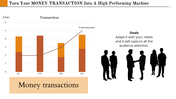
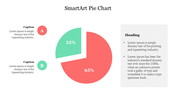
    You May Also Like These PowerPoint Templates

    Add to Wishlist
    Download
    AI Customize
    Slide featuring a colorful tachometer diagram explaining its components, functionality, and usage with icons.
    Add to Wishlist
    Download
    AI Customize
    RAG dashboard with red, yellow, and green sections showing project status, using bar, line, and pie charts.
    Free
    Add to Wishlist
    Download
    AI Customize
    Automotive Dashboard PPT Presentation and Google Slides
    Add to Wishlist
    Download
    AI Customize
    Easily Editable Progress Dashboard Template
    Add to Wishlist
    Download
    AI Customize
    Circular dashboard graphic with five colored sections labeled surrounding a central gauge with a red needle.
    Free
    Add to Wishlist
    Download
    AI Customize
    Two speedometers with red and purple needle pointers, with caption and corresponding colored dots below.
    Add to Wishlist
    Download
    AI Customize
    3D sales chart displaying a 60 percent sales progress with an informative text section and interactive button on blue theme.
    Add to Wishlist
    Download
    AI Customize
    Sales report slide showing metrics like sales volume, profit margin, and a gauge chart along with a bar graph.
    Add to Wishlist
    Download
    AI Customize
    KPI slide highlighting essential business metrics alongside color coded sections for quick reference and analysis.
    Add to Wishlist
    Download
    AI Customize
    Sentiment meter infographic displaying six emotions in a colorful fan design, each labeled with placeholders text areas.
    Add to Wishlist
    Download
    AI Customize
    KPI Dashboard PowerPoint template displaying key metrics, including count of contracts, revenues, and costs.
    Add to Wishlist
    Download
    AI Customize
    Tachometer template with percentage markers and color-coded designs, each paired with caption areas.
    Add to Wishlist
    Download
    AI Customize
    Executive dashboard template showcasing growth, progress, and performance metrics for effective management.
    Add to Wishlist
    Download
    AI Customize
    Dashboard slide with two green gauge meters, each labeled with a caption and text below.
    Add to Wishlist
    Download
    AI Customize
    Microsoft dashboard slide showcasing supply chain costs, inventory to sales ratio, and carrying cost of inventory.
    Add to Wishlist
    Download
    AI Customize
    Project status dashboard slide displaying budgets and performance metrics for banners, social media, and brochures.
    Add to Wishlist
    Download
    AI Customize
    PowerPoint slide with a tachometer graphic showing numbers 1 through 8 in different colors, with placeholders for captions.