Efficient KPI Dashboard Template PowerPoint

Dashboard layout showing net worth value, asset categories in a pie chart, and bar chart for real estate comparisons.
P.ID : 1643
    729 views
    29 Downloads
    Get Custom Slides by Experts
    Instantly Access Templates in PowerPoint

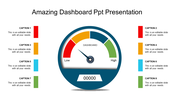
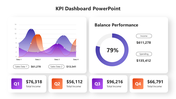
    KPI Dashboard for Business Management

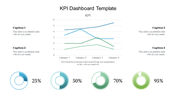
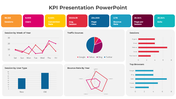
    Analyze your company performance with the KPI Dashboard PPT template. Our pre-made template will save you time and effort. The key Performance Indicator is known as KPI. It exposes your business analysis with multiple charts like pie charts, bar graphs, and other graphs. The tracking and reporting of business performance are made easier with the aid of this KPI dashboard. Six different parts of the template can be edited. You can change the colors and pictures. Try it now. 

    Features of the Template

    • 100% customizable slides and easy to download.
    • Slides are available in different nodes & colors.
    • The slide contains 16:9 and 4:3 formats.
    • Easy to change the colors of the slide quickly.
    • Well-crafted template with an instant download facility.
    • Business performance management.
    • Effective creation.
    Advertisement

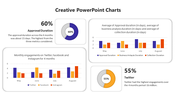
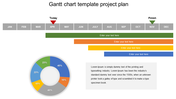
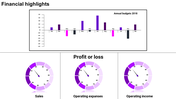
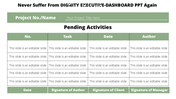
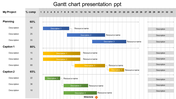
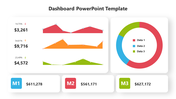
    You May Also Like These PowerPoint Templates

    Add to Wishlist
    Download
    AI Customize
    Dashboard slide showing Zantedeschia, Celosia, and Calendula growth data with a bar chart from 2012 to 2017.
    Add to Wishlist
    Download
    AI Customize
    Business dashboard with progress indicators for promotion, channel management, and revenue metrics.
    Add to Wishlist
    Download
    AI Customize
    A dashboard style slide showing plant growth data for Zantedeschia, Celosia, and Calendula with gauge charts and a bar graph.
    Free
    Add to Wishlist
    Download
    AI Customize
    Comparison of revenue and cost distributions with pie charts displaying CAPEX and OPEX percentages.
    Free
    Add to Wishlist
    Download
    AI Customize
    Horizontal Gantt chart showing tasks by days with segments in blue, purple, and black, indicating task progress and status.
    Add to Wishlist
    Download
    AI Customize
    Funnel infographic with blue, red, yellow, and green sections, each with icons, connected to text descriptions.
    Free
    Add to Wishlist
    Download
    AI Customize
    Four vertical orange columns and percentages, labeled by year, along with a businesswoman illustration on the right.
    Add to Wishlist
    Download
    AI Customize
    Botanical data dashboard template  showing performance metrics for flower species, featuring line and bar charts.
    Free
    Add to Wishlist
    Download
    AI Customize
    Colorful dashboard style meters PPT slide with captions and placeholder text.
    Free
    Add to Wishlist
    Download
    AI Customize
    Dashboard layout featuring a line graph, pie chart, net worth value, and categorized assets and liabilities in green theme.
    Add to Wishlist
    Download
    AI Customize
    PowerPoint slide with multiple chart types, including bar, line, and pie charts with different styles.
    Free
    Add to Wishlist
    Download
    AI Customize
    Executive dashboard slide featuring different vehicles like bike, car, container, train, and plane with title sections.
    Free
    Add to Wishlist
    Download
    AI Customize
    Chart with colorful bars representing yearly data from 2013 to 2020, paired with eight colorful cube icons on the sides.
    Add to Wishlist
    Download
    AI Customize
    Gantt chart PPT slide displaying tasks with start and end dates, milestones, and progress tracking for each month.
    Add to Wishlist
    Download
    AI Customize
    KPI dashboard featuring a funnel chart, audience metrics, bar graph, and a circular chart with 2021 data.
    Add to Wishlist
    Download
    AI Customize
    Infographic chart with a truck carrying five colorful blocks and percentage bars, using green, orange, and brown tones.
    Free
    Add to Wishlist
    Download
    AI Customize
    Executive dashboard template featuring six blue columns with titles and alternating light and dark blue text boxes.
    Free
    Add to Wishlist
    Download
    AI Customize
    Bar chart PowerPoint slides showcasing different business categories with colorful bars in different layout designs.
    Add to Wishlist
    Download
    AI Customize
    Gantt chart slide with monthly columns showing project tasks and subtasks progress using blue shades to indicate status.
    Free
    Add to Wishlist
    Download
    AI Customize
    Gantt chart slide with monthly timeline across three teams, using blue, orange, and green bars to indicate priority items.