Ready To Use PowerPoint Dashboard Template Free Download

Blue themed dashboard layout with a line chart, two growth metrics, and three semi circle gauges for budget.
P.ID : 41725
    263 views
    29 Downloads
    Get Custom Slides by Experts
    Instantly Access Templates in PowerPoint

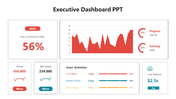
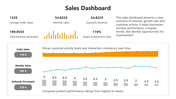
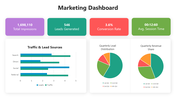
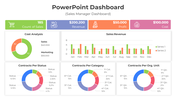
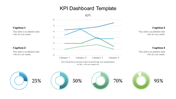
    Snapshot Design for a Data-Driven Dashboard

    Working on a project is by no means simple. You only need to have a look at and download this incredible data-driven dashboard snapshot design presentation to make it simple. The dashboard outlines the financial or sales operations, the outcomes that will be achieved, and how the targets will be met. The utilization of imaginative visual symbols enables users to obtain an engaging template. 
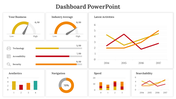
    In fact, you can utilize this template to make your presentation engaging and interactive at the same time. For issues relating to sales, marketing, management, and finances, use this PPT presentation example. Planning a project is all-encompassing and comprehensive. Stakeholders and experts can consult this PPT for Using your assistance and can alter the graphics. Your ideas are advanced by the design of this dashboard. They receive the attention they merit.

    Features of the Template

    • 100 % customizable slides and easy to download.
    • Slides are available in different colors
    • The slide has 4:3 and 16:9 formats.
    • Easy to change the slide colors quickly.
    • Appealing Presentation to impress an audience.
    • Create feature-rich slide presentations. 
    • An eye-pleasing color slide helps to give a catchy display.
    • Excellent dashboard design Presentation.
    Advertisement

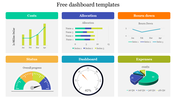
    You May Also Like These PowerPoint Templates

    Add to Wishlist
    Download
    AI Customize
    Project management dashboard with charts for budget, progress, risks, workload, and projected launch date and icons.
    Add to Wishlist
    Download
    AI Customize
    PowerPoint slide with KPI dashboard metrics, including revenue, sales by month, and customer revenue comparison.
    Free
    Add to Wishlist
    Download
    AI Customize
    KPI Dashboard with bubbles for sales, attendance, download, and report and a client location legend.
    Add to Wishlist
    Download
    AI Customize
    KPI Training slide featuring a social media analysis table with metrics for followers, mentions, interactions, and shares.
    Add to Wishlist
    Download
    AI Customize
    Task management dashboard slide showing task numbers and completion percentages with colored gauge icons.
    Add to Wishlist
    Download
    AI Customize
    Revenue dashboard with bar charts, statistics, and sliders showing data metrics in various colors.
    Add to Wishlist
    Download
    AI Customize
    Editable Speedometer PowerPoint Template Presentation
    Add to Wishlist
    Download
    AI Customize
    Color coded executive dashboard slide displaying a timeline of tasks, various sections, and charts.
    Add to Wishlist
    Download
    AI Customize
    Slide featuring a colorful tachometer diagram explaining its components, functionality, and usage with icons.
    Add to Wishlist
    Download
    AI Customize
    RAG dashboard with red, yellow, and green sections showing project status, using bar, line, and pie charts.
    Free
    Add to Wishlist
    Download
    AI Customize
    Automotive Dashboard PPT Presentation and Google Slides
    Add to Wishlist
    Download
    AI Customize
    Two circular charts show metrics in red and green, representing key performance indicators for warehouse operations.
    Add to Wishlist
    Download
    AI Customize
    Easily Editable Progress Dashboard Template
    Add to Wishlist
    Download
    AI Customize
    Circular dashboard graphic with five colored sections labeled surrounding a central gauge with a red needle.
    Free
    Add to Wishlist
    Download
    AI Customize
    Two speedometers with red and purple needle pointers, with caption and corresponding colored dots below.
    Add to Wishlist
    Download
    AI Customize
    3D sales chart displaying a 60 percent sales progress with an informative text section and interactive button on blue theme.
    Add to Wishlist
    Download
    AI Customize
    Sales report slide showing metrics like sales volume, profit margin, and a gauge chart along with a bar graph.
    Add to Wishlist
    Download
    AI Customize
    KPI slide highlighting essential business metrics alongside color coded sections for quick reference and analysis.