Innovative Project Risk Management Slide Template

Dashboard with four bar charts in yellow, green, teal, and red, comparing project risks and change requests.
P.ID : 31553
    471 views
    22 Downloads
    Get Custom Slides by Experts
    Instantly Access Templates in PowerPoint

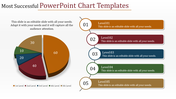
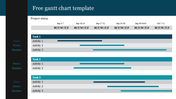
    Amazing Project risk template


    How about downloading this Project risk management template for your creative presentation. The template is creative with a table design that can enhance the presentation look. The template is explicit with the text area, which gives a detailed outlook of the topic. The template is added with four nodes that you can edit.


    About the template


    Use this template for business presentations. Add this template with user-friendly features that can bring a new look to the template. Since this template is fully customized, you can edit it according to the use. Try now! Download this awesome Project risk management template and gain success.


    Features of this Template

    1. It is a 100% customized template
    2. It is easy to download.
    3. Templates are available in different nodes & colors.
    4. The slide contained 16:9 and 4:3 formats.
    5. Easy to change the slide colors quickly.
    6. Well-crafted template with instant download facility.
    7. Creative design with text area.

    Advertisement

    You May Also Like These PowerPoint Templates

    Free
    Add to Wishlist
    Download
    AI Customize
    A PPT chart template featuring a table layout with rows labeled Text and columns with bar charts in different shades of blue.
    Add to Wishlist
    Download
    AI Customize
    Slide with multiple charts including bar, line, and pie charts illustrating data for hires, turnover, and training.
    Add to Wishlist
    Download
    AI Customize
    Bar chart slide design with stacked bars showing three categories per item and percentage captions on the left.
    Add to Wishlist
    Download
    AI Customize
    A donut chart with four sections in green, red, and white, labeled with percentages, and text boxes around it.
    Add to Wishlist
    Download
    AI Customize
    Business column chart template showing four bar sections, each representing industries with icons and data percentages.
    Add to Wishlist
    Download
    AI Customize
    Colorful bar chart PPT template displaying four sections with data values and corresponding captions for 2018 to 2021.
    Add to Wishlist
    Download
    AI Customize
    Gantt chart with a task breakdown, progress percentages, and a status table for project planning and execution.
    Free
    Add to Wishlist
    Download
    AI Customize
    Line chart with data points marked by blue squares and black dots, displaying values from 2006 to 2014.
    Add to Wishlist
    Download
    AI Customize
    Gantt chart with colorful horizontal bars spanning from January to June, representing project timelines and milestones.
    Free
    Add to Wishlist
    Download
    AI Customize
    PowerPoint slide with a bar chart showcasing three data series for different examples.
    Add to Wishlist
    Download
    AI Customize
    Chart layout with stacked bar graphs in red, yellow, green, and teal representing A1 to A8, with captions above.
    Add to Wishlist
    Download
    AI Customize
    Slide showing a bar chart with values for 2017, 2018, 2019, and 2020, with each year represented in different shades of blue.
    Add to Wishlist
    Download
    AI Customize
    Matrix chart with skill and will axes, divided into quadrants labeled high and low, with numbered circles and icons.
    Add to Wishlist
    Download
    AI Customize
    PowerPoint chart template displaying three donut charts with percentages and icons representing data categories.
    Add to Wishlist
    Download
    AI Customize
    Project plan Gantt chart template displaying tasks with milestones and progress percentages across months from Jan to Dec.
    Add to Wishlist
    Download
    AI Customize
    Bar chart presentation showing data from 2017 to 2020, with values 2.4, 4.4, 1.8, and 2.8, respectively.
    Add to Wishlist
    Download
    AI Customize
    Two vertical bar charts with three columns each, alongside captions with percentages in varying shades of orange.
    Free
    Add to Wishlist
    Download
    AI Customize
    Revenue analysis slide with bar chart, financial icon, and two descriptive sections for customer metrics.
    Add to Wishlist
    Download
    AI Customize
    3D pie chart with four color-coded segments red, orange, yellow, and brown displaying percentage values.
    Free
    Add to Wishlist
    Download
    AI Customize
    Bar chart slide with three stacked bars, each divided into segments with percentage labels, and a table on the right.