Super-Duper Chart Template PPT Diagram For Your Need


Dashboard Chart Presentation Slide
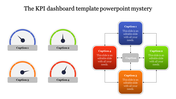
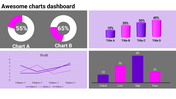
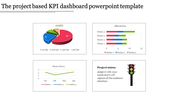
Step into the future of presentations with our Chart Template PPT – a dynamic blend of aesthetics and functionality! Captivate your audience instantly with four 3D circle images, each housing dashboards in circular, bar, and wave models, all set in an eye-catching green and yellow palette. This versatile slide caters to business professionals and students alike, seamlessly integrating completed tasks, tasteful designs, ongoing projects, and the pivotal role of a project manager through sleek typography.Whether you're delivering a business report or an academic presentation, this template simplifies complex data visualization. The user-friendly interface ensures a seamless experience, allowing you to effortlessly convey information.
Crafted for easy comprehension, the slide provides text areas for additional context, making it perfect for professionals and students seeking impactful and visually appealing presentations.
Why settle for ordinary when you can elevate your storytelling? Make an impact, engage your audience, and download our Chart Template PPT now. Transform your presentations with this innovative tool that combines style and substance, promising to revolutionize the way you communicate data and ideas! Don't miss out on the future of dynamic presentations – grab your template today!
Features of the template
- 100% customizable slides and easy to download.
- Slides are available in different colors
- The slide has 4:3 and 16:9 formats.
- Easy to change the slide colors quickly.
- Appealing Presentation to impress an audience.
- Create feature-rich slide presentations.
- An eye-pleasing color slide helps to give a catchy display.
- It is apt with PPT and Google Slides.


You May Also Like These PowerPoint Templates

Add to Wishlist
Download
AI Customize


Add to Wishlist
Download
AI Customize

Add to Wishlist
Download
AI Customize

Add to Wishlist
Download
AI Customize

Add to Wishlist
Download
AI Customize

Add to Wishlist
Download
AI Customize

Add to Wishlist
Download
AI Customize


Add to Wishlist
Download
AI Customize


Free
Add to Wishlist
Download
AI Customize

Add to Wishlist
Download
AI Customize

Free
Add to Wishlist
Download
AI Customize

Free
Add to Wishlist
Download
AI Customize

Add to Wishlist
Download
AI Customize


Add to Wishlist
Download
AI Customize
