Fact Sheet PowerPoint Presentation Template & Google Slides

Business fact sheet slide featuring an orange bar graph from 2019 to 2022 and company highlights with text area.
P.ID : 59220
    4.1K+ views
    317 Downloads
    Get Custom Slides by Experts
    Instantly Access Templates in PowerPoint

    Four Noded Facts Presentation Slide

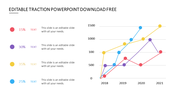
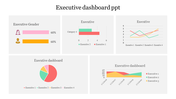
    Present your online ads report more professionally using this well-designed Fact Sheet Template PowerPoint Slide. It can be a valuable tool to make your presentation more organized and more appealing. This template can be customized to meet your business needs. It is very helpful in making presentations easier and faster.

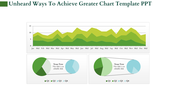
    The Fact Sheet Template PowerPoint Slide is a creative slide with four nodes. It has a chart to showcase the facts. Using this template, you can present the report on customer reactions on online ads. It has a clean white background with simple graphics to give a professional look to your presentations. Using this template, you can make a well-organized presentation at ease.

    Features of this template:

    1. 100% customizable slides and easy to download.
    2. Slides available in different nodes & colors.
    3. The slide contained 16:9 and 4:3 format.
    4. Easy to change the slide colors quickly.
    5. Well-crafted template with instant download facility.
    6. Best slide to present the facts.
    Advertisement

    You May Also Like These PowerPoint Templates

    Add to Wishlist
    Download
    AI Customize
    Slide with three donut shaped percentage charts showing 70%, 50%, and 90%, with corresponding captions beneath each.
    Add to Wishlist
    Download
    AI Customize
    Five vibrant 3D blocks in purple, green, orange, blue, and yellow, with captions for each section.
    Add to Wishlist
    Download
    AI Customize
    Gantt chart in blue tones, showing task progress over weeks with horizontal bars and assigned team members.
    Free
    Add to Wishlist
    Download
    AI Customize
    A PPT chart template featuring a table layout with rows labeled Text and columns with bar charts in different shades of blue.
    Add to Wishlist
    Download
    AI Customize
    Slide with multiple charts including bar, line, and pie charts illustrating data for hires, turnover, and training.
    Add to Wishlist
    Download
    AI Customize
    Bar chart slide design with stacked bars showing three categories per item and percentage captions on the left.
    Add to Wishlist
    Download
    AI Customize
    Business column chart template showing four bar sections, each representing industries with icons and data percentages.
    Add to Wishlist
    Download
    AI Customize
    Colorful bar chart slide for an annual report in PowerPoint, displaying monthly data from January to December.
    Add to Wishlist
    Download
    AI Customize
    Executive dashboard with a pie chart, vertical and horizontal bar graph, and a waterfall chart, displaying various data.
    Add to Wishlist
    Download
    AI Customize
    Colorful bar chart PPT template displaying four sections with data values and corresponding captions for 2018 to 2021.
    Add to Wishlist
    Download
    AI Customize
    Gantt chart with a task breakdown, progress percentages, and a status table for project planning and execution.
    Add to Wishlist
    Download
    AI Customize
    Business dashboard featuring a profile card, three financial metrics, a 67% circular chart, and a dual-colored area graph.
    Add to Wishlist
    Download
    AI Customize
    A colorful dashboard PowerPoint slide featuring graphs, stats, and a pie chart for a data driven presentation with captions.
    Add to Wishlist
    Download
    AI Customize
    Dashboard PowerPoint slide featuring three speedometer style gauges displaying percentages with a dartboard graphic.
    Free
    Add to Wishlist
    Download
    AI Customize
    Line chart with data points marked by blue squares and black dots, displaying values from 2006 to 2014.
    Add to Wishlist
    Download
    AI Customize
    Executive dashboard PowerPoint slide featuring line and bar charts, pie charts, and world map markers for data analysis.
    Add to Wishlist
    Download
    AI Customize
    Gantt chart with colorful horizontal bars spanning from January to June, representing project timelines and milestones.
    Free
    Add to Wishlist
    Download
    AI Customize
    PowerPoint slide with a bar chart showcasing three data series for different examples.
    Add to Wishlist
    Download
    AI Customize
    Chart layout with stacked bar graphs in red, yellow, green, and teal representing A1 to A8, with captions above.