Free - Gantt Chart PowerPoint Templates and Google Slides Themes

Free
A detailed Gantt chart slide illustrating project timelines with tasks spanning different durations for 2021 and 2022.
P.ID : 3807
    6.3K+ views
    1.7K+ Downloads
    Get Custom Slides by Experts
    Instantly Access Templates in PowerPoint

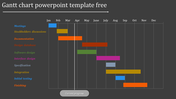
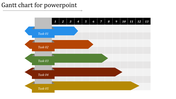
    Streamline Your Projects with Our Gantt Chart PowerPoint Template


    Did you know that the Gantt chart was invented by Henry L. Gantt in the early 20th century to manage complex projects? Our "Gantt Chart PowerPoint" template is designed to help you plan and manage your projects efficiently. With a bold title and clean white background, it’s perfect for visually representing timelines, tasks, and progress.

    What this template explains

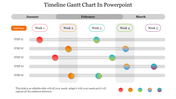
    This Gantt chart slide provides a clear way to outline project schedules. It covers start and end dates, task duration, dependencies, and overall progress, making it easy for teams to understand timelines and deadlines.

    Purpose of the Slide

    The slide’s purpose is to offer a professional tool for tracking and organizing project tasks. It ensures all team members are aligned and aware of their responsibilities and deadlines, aiding in efficient project planning and execution.

    Who can use this template?

    Ideal for business professionals and project managers. This Gantt chart PowerPoint template is perfect for anyone involved in project planning. Whether for business meetings or academic presentations, it ensures clear and effective project tracking.

    Get started today!

    Features of the template:


    • 100% customizable slides and easy to download.
    • The slides contain 16:9 and 4:3 formats.
    • Easy to change the colors quickly.
    • It is a 100% pre-designed slide.
    Advertisement

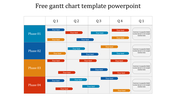
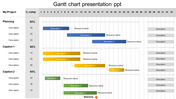
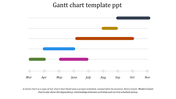
    You May Also Like These PowerPoint Templates

    Free
    Add to Wishlist
    Download
    AI Customize
    Slide with four green donut charts and two horizontal bar graphs showing data comparisons across quarters and months.
    Free
    Add to Wishlist
    Download
    AI Customize
    Illustration of six red bars with corresponding percentages and a businesswoman standing beside them.
    Free
    Add to Wishlist
    Download
    AI Customize
    Dashboard template with a circular speedometer gauge in the center, divided into five blue segments labeled 01 to 05.
    Free
    Add to Wishlist
    Download
    AI Customize
    Business strategy chart with blue headers for months, showing green bars representing schedules.
    Add to Wishlist
    Download
    AI Customize
    Stacked bar chart with four vertical bars showing percentages from 2013, 2014, and 2015 in varying green shades.
    Free
    Add to Wishlist
    Download
    AI Customize
    Business plan slide showing bar chart comparing impact of society, customer satisfaction, and people satisfaction.
    Add to Wishlist
    Download
    AI Customize
    Data driven financial presentation slide featuring revenue, profit, and customer metrics, along with trend graphs.
    Free
    Add to Wishlist
    Download
    AI Customize
    KPI dashboard bar chart slide representing the height of the world's tallest hills with a world map marking their locations.
    Free
    Add to Wishlist
    Download
    AI Customize
    Dashboard infographic with three gauge meters in blue, green, and yellow, each labeled with a number and caption.
    Add to Wishlist
    Download
    AI Customize
    KPI dashboard slide with line chart, showing performance for four categories, along with circular percentage indicators.
    Add to Wishlist
    Download
    AI Customize
    Speedometer KPI dashboard showing speed readings for three vehicles a truck, a van, and a car.
    Add to Wishlist
    Download
    AI Customize
    KPI dashboard PowerPoint slide showing a bar chart with active accounts for different categories and percentage indicators.
    Add to Wishlist
    Download
    AI Customize
    Template showcasing various chart designs, including line, bar, pie, and comparison charts across multiple slides.
    Add to Wishlist
    Download
    AI Customize
    Six panel infographic featuring KPI metrics with colorful charts, graphs, and numerical data insights.
    Add to Wishlist
    Download
    AI Customize
    Creative charts showing a circular 60% approval metric, bar graphs, and a 55% Twitter engagement donut chart.
    Add to Wishlist
    Download
    AI Customize
    Financial highlights slide with bar chart and circular gauges tracking sales, operating income, and expenses.
    Free
    Add to Wishlist
    Download
    AI Customize
    Bar chart comparing metrics over years alongside a diagram linking manager, idea, and management to business growth.
    Free
    Add to Wishlist
    Download
    AI Customize
    Dashboard with line graphs, a circular chart with three segments, and labeled financial metrics, in red, orange, and green.
    Add to Wishlist
    Download
    AI Customize
    Dashboard slide showing Zantedeschia, Celosia, and Calendula growth data with a bar chart from 2012 to 2017.