Insightful Dashboard PowerPoint Template for Data Analysis

Dashboard with three charts and two vertical bar and line charts on the right, each labeled with placeholder text areas.
P.ID : 34860
    753 views
    68 Downloads
    Get Custom Slides by Experts
    Instantly Access Templates in PowerPoint

    Visualize Your Data: Dashboard PPT Template and Google Slides


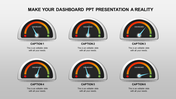
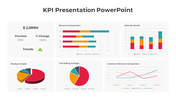
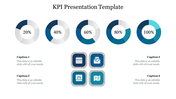
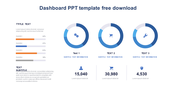
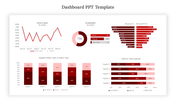
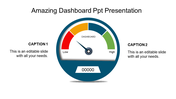
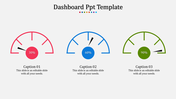
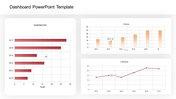
    Step into the realm of data visualization excellence with our Dashboard PowerPoint Template and Google Slides Themes. This dynamic template features three customizable graphs, empowering users to effortlessly translate raw data into compelling visual insights. Whether you're a business analyst, project manager, or executive, our Dashboard template equips you with the tools to present complex information in a clear and engaging manner. From boardroom presentations to academic lectures, leverage the power of visualization to captivate your audience and drive informed decision-making. With editable charts that seamlessly integrate your data, this template is the ultimate solution for professionals seeking to elevate their presentations and make a lasting impact. Enhance your storytelling, showcase your expertise, and unlock new opportunities with our template.

    Features of the template


    • 100% customizable slides are easy to download.
    • Slides are available in different colors.
    • The slide has 4:3 and 16:9 formats.
    • It is easy to change the slide colors quickly.
    • It has a cute design to impress an audience.
    • Create feature-rich, animated presentations.
    • This slide is available in both PowerPoint and Google Slides.
    Advertisement

    You May Also Like These PowerPoint Templates

    Add to Wishlist
    Download
    AI Customize
    Project plan Gantt chart template displaying tasks with milestones and progress percentages across months from Jan to Dec.
    Add to Wishlist
    Download
    AI Customize
    KPI PowerPoint template with a gauge and table for displaying yearly financial data on a white backdrop.
    Add to Wishlist
    Download
    AI Customize
    Bar chart presentation showing data from 2017 to 2020, with values 2.4, 4.4, 1.8, and 2.8, respectively.
    Free
    Add to Wishlist
    Download
    AI Customize
    Horizontal timeline graphic with five purple arrows, labeled captions and date ranges, aligned with a month indicator.
    Add to Wishlist
    Download
    AI Customize
    Speedometer dashboard PowerPoint slides showing three colored gauges with 25, 50, and 75 percent progress with captions.
    Add to Wishlist
    Download
    AI Customize
     Project timeline chart with horizontal bars indicating tasks with milestone markers placed in white background.
    Add to Wishlist
    Download
    AI Customize
    Dashboard PPT slide showcasing defect rates, supplier analysis, revenue breakdown, and delivery time analysis with charts.
    Add to Wishlist
    Download
    AI Customize
    KPI PowerPoint slide featuring three colored gauges for Revenue, Sales, and Sales Value with respective values.
    Add to Wishlist
    Download
    AI Customize
    Two vertical bar charts with three columns each, alongside captions with percentages in varying shades of orange.
    Add to Wishlist
    Download
    AI Customize
    KPI dashboard template with bar and line graphs showing private school growth for 2017, 2018, and 2019 with educational data.
    Free
    Add to Wishlist
    Download
    AI Customize
    Free KPI Presentation PPT Template and Google Slides
    Add to Wishlist
    Download
    AI Customize
    Executive Dashboard slide showing key performance metrics such as revenue vs. target, customer acquisition, and CAC vs. CLV.
    Free
    Add to Wishlist
    Download
    AI Customize
    Colorful project dashboard PPT slide showing a bar chart for four sections with a pie chart detailing percentages.
    Add to Wishlist
    Download
    AI Customize
    Central speedometer style gauge with red, yellow, blue, and green sections, surrounded by numbered text boxes.
    Add to Wishlist
    Download
    AI Customize
    KPI dashboard with a dual-line graph, balance performance gauge, and quarterly income metrics.
    Add to Wishlist
    Download
    AI Customize
    Business dashboard with progress indicators for promotion, channel management, and revenue metrics.
    Free
    Add to Wishlist
    Download
    AI Customize
    Colorful dashboard style meters PPT slide with captions and placeholder text.