PowerPoint Presentation Charts for Data Visualization

Infographic template with bar, pie, and world map charts for PowerPoint presentations in shades of red and orange.
P.ID : 6157
    919 views
    91 Downloads
    Get Custom Slides by Experts
    Instantly Access Templates in PowerPoint

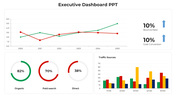
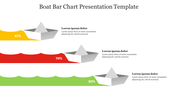
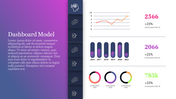
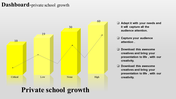
    Chart Presentation Template 


    In the world of data-driven choices, showing your info in a cool way is a game-changer. That's where our PowerPoint Presentation Charts template steps in – helping you turn boring data into eye-catching visuals that stick with your crowd.

    No more snooze-worthy slides! Our template comes packed with charts that make your data look awesome. Customizable graphs, cool diagrams – you name it. Creating visuals that speak to your audience has never been easier.

    Whether you're a pro, a teacher, or just someone who loves clear presentations, this template is your go-to. It's built for anyone who wants to share data in a way that clicks.

    Don't settle for dull. Go for dazzling! Our template makes your data a star. Jazz up your presentation, get your audience hooked, and turn your info into a showstopper.Ready to make your data shine? Download our PowerPoint Presentation Charts template now!

    Features of the template:

    • Easy to change the slide colors.
    • 100 % customizable slides and easy to download.
    • Well-crafted template with instant download.
    Advertisement

    You May Also Like These PowerPoint Templates

    Add to Wishlist
    Download
    AI Customize
    Dashboard slide with six gauge meters displaying low to high ranges, each labeled with captions below.
    Add to Wishlist
    Download
    AI Customize
    Circular tachometer design with a central gauge and surrounding colored segments, each linked to captions on the right.
    Add to Wishlist
    Download
    AI Customize
    A vertical green color bar chart slide displaying loss data from 2014 to 2019, with the title at the top.
    Add to Wishlist
    Download
    AI Customize
    Dashboard slide showing colour coded plant growth chart with progress ring visuals and percentages.
    Add to Wishlist
    Download
    AI Customize
    Dashboard slide showing sales bar chart with a highlighted value and a gauge representing business metrics.
    Free
    Add to Wishlist
    Download
    AI Customize
    Map-based analysis design with statistical data visuals including circular graphs and demographic distributions.
    Add to Wishlist
    Download
    AI Customize
    KPI dashboard layout with blue and green line graphs at the top and shaded bar charts at the bottom in gradient colors.
    Free
    Add to Wishlist
    Download
    AI Customize
    Gantt chart slide showing six tasks with progress bars, each reflecting completion levels ranging from 30% to 80%.
    Add to Wishlist
    Download
    AI Customize
    Financial dashboard with bar charts in pink and blue, colored circular pie charts, and teal boxes highlighting metrics.
    Add to Wishlist
    Download
    AI Customize
    Speedometer template with a needle pointing at 70%, featuring a section in a whote backdrop for a caption areas.
    Add to Wishlist
    Download
    AI Customize
    Four orange pie charts with center numbers from 01 to 04, each with text placeholders on the right.
    Add to Wishlist
    Download
    AI Customize
    Microsoft PowerPoint slide featuring three donut charts in yellow, orange, and pink, each with different percentage values.
    Add to Wishlist
    Download
    AI Customize
    Speedometer template with four gauges displaying percentages: blue at 70%, orange at 50%, dark red at 55%, and red at 85%.
    Add to Wishlist
    Download
    AI Customize
    Business chart with three line graphs representing data over four years, and yellow, red, and purple captions.
    Add to Wishlist
    Download
    AI Customize
    Horizontal Gantt chart with blue bars representing tasks, timeline from March to April 2020, and gray grid lines.
    Free
    Add to Wishlist
    Download
    AI Customize
    Line chart template with two data series on a dark background, featuring a calculator and pen in the background.